Difference between revisions of "Presage/User Guide/How to:"
| Line 1,193: | Line 1,193: | ||
[[File:AUTOINVESTIGATIONSETTING.png|center]] | [[File:AUTOINVESTIGATIONSETTING.png|center]] | ||
Below is how this feature works: | |||
[[File:Investigationmobile.jpg|center]] | |||
Latest revision as of 13:40, 2 November 2015
How to create a work order.
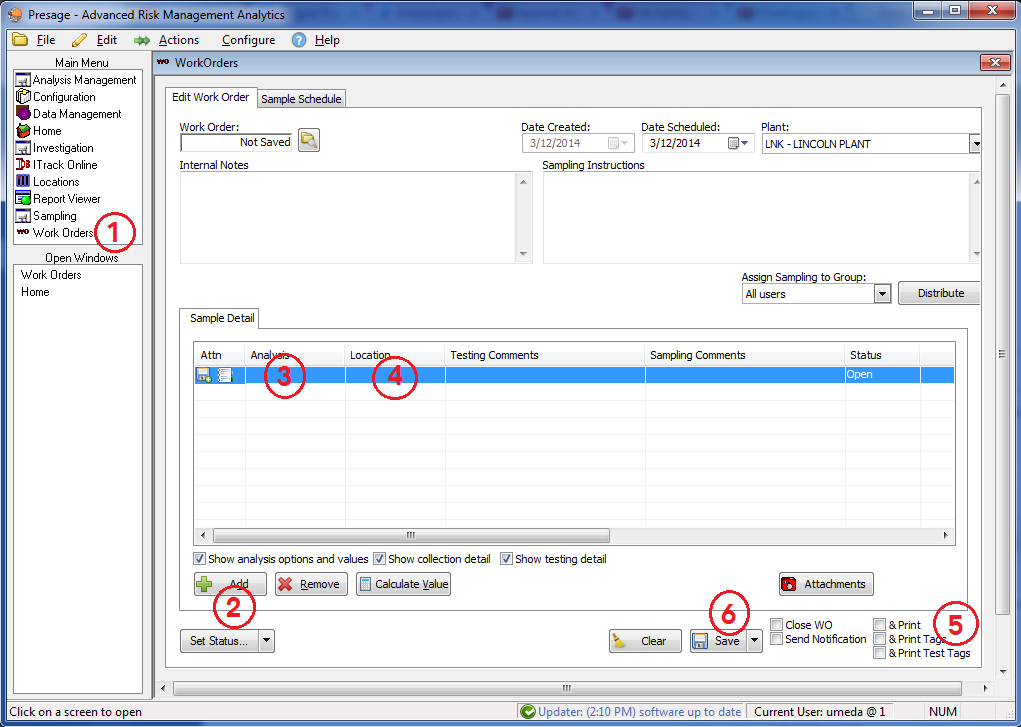
1. Click on the Work Order screen under Main Menu.
2. Click the Add button on the lower-left of the Edit Work Order tab.
3. Once the row is selected, click on the cell below Analysis to choose an analysis name.
4. Click on the cell below Location to choose a location name.
Note: If there are multiple analyses to be entered, click the Add button multiple times to make the rows editable.
Note: Make sure to remove any blank editable rows before saving the work order. Select the row to be deleted, and click Remove.
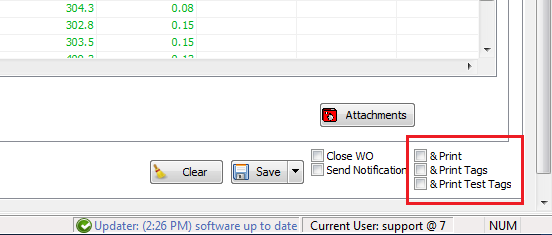
5. Check the appropriate boxes next to printing options.
Remember: &Print prints letter size reports.
&Print Tags has two options: with Barcode and without Barcode. Usually it's a 1.1 x 2.4 label, but it can be customized to your needs.
&Print Test Tags prints very thin labels with barcodes. These are meant for sticking on petri dishes and petri films.
6. Click Save.
How to hide unnecessary columns from the work order screen.
Uncheck the appropriate boxes on the lower portion of work order screen.
The Show analysis and option values box collapses option name columns.
The Show collection detail box collapses columns titled Performed On and Performed By.
The Show testing detail box collapses columns titled Testing Began, Testing Ended and Tested By.
How to open a closed work order.
1) Pull up the work order in the work order screen.
2) Click on the Set Status button on the lower left, select Re-open closed work order.
How to edit a closed sample.
1) Pull up the work order in the work order screen.
2) Click on the Set Status button on the lower left, select Only Selected Items... or All items..., then select To Sampled.
3) Click Re-Open WO on the pop-up dialog.
How to invalidate a sample.
In the work order screen, select the row, click on the arrow next to Set Status... on the bottom-left corner. Hover over Only Selected Items or All Items then click on To Cancelled....
Invalidated samples do not show in the Sample History.
How to send an analysis for investigation.
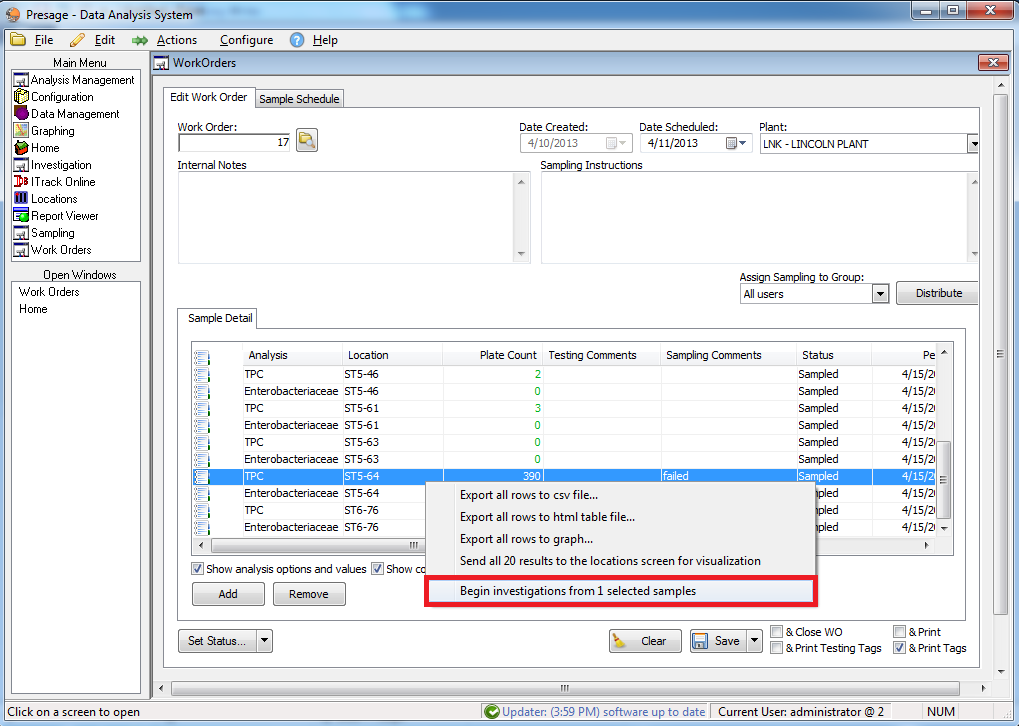
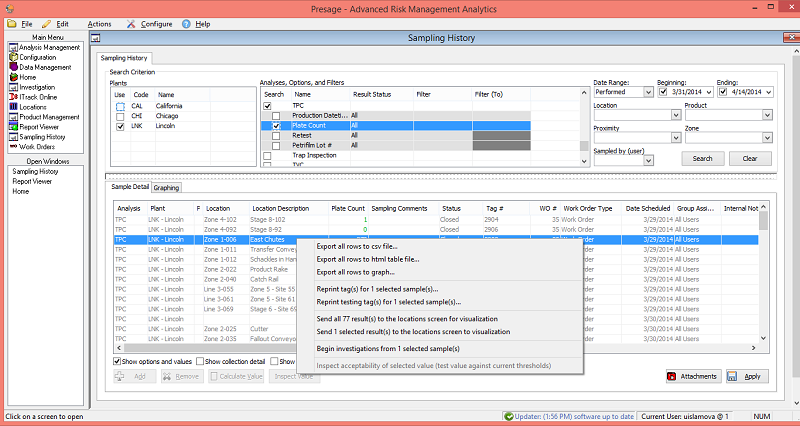
To send an analysis for investigation, select the sample analysis from the Work Order screen or Sampling History; right-click on it, and select Begin investigation from # selected samples.
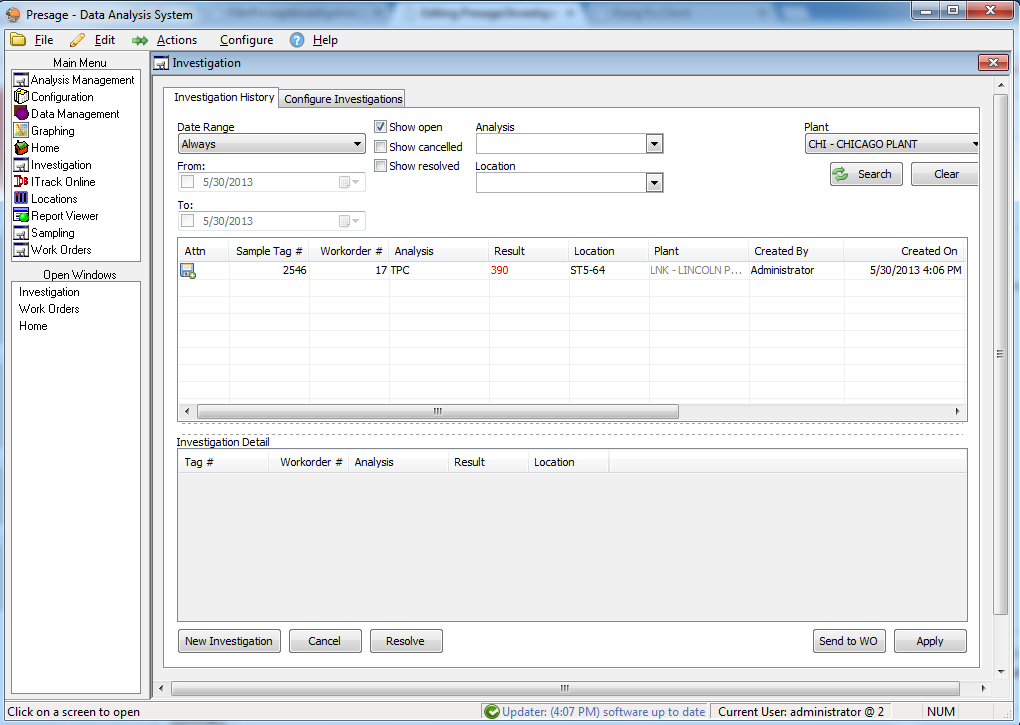
User is automatically taken to the Investigation Screen.
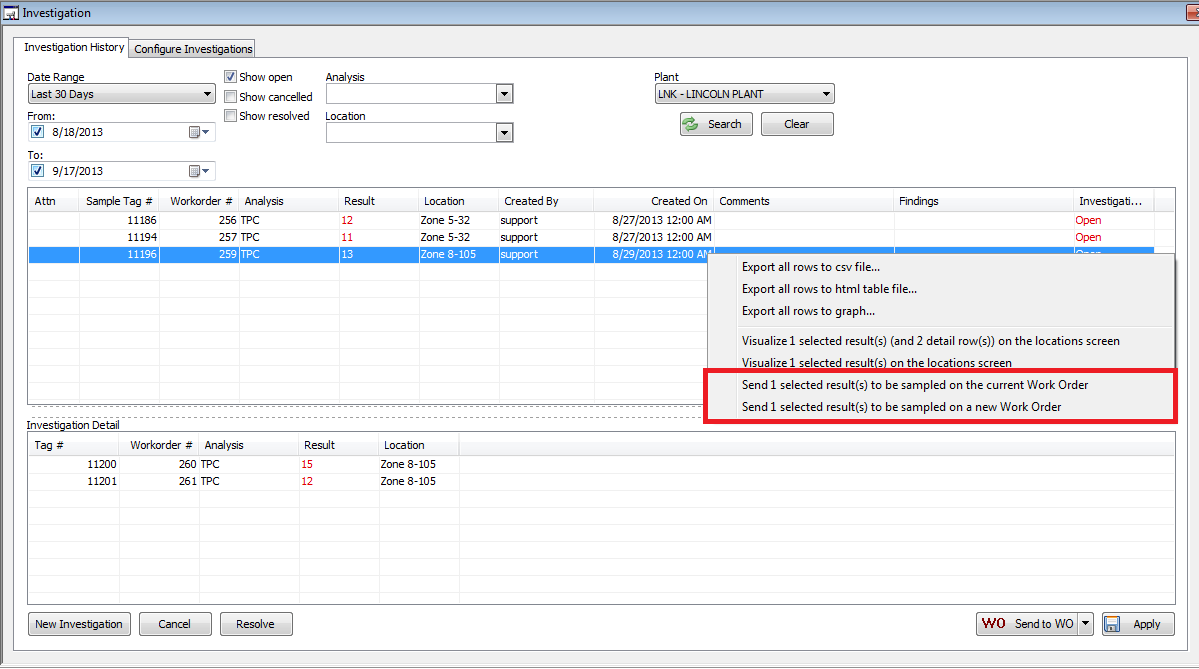
Right-click on the analysis on this page to see multiple action options: view the location visualization or send to the work order. There is also a Send to WO button on the lower, right-hand portion of the screen. Click on the arrow next to the Send to WO button, choose between Send to Existing WO and Send to New WO.
Drag the bar to the right to see the column titled Comments and Findings. Type in the findings and corrective actions taken in the space provided.
If there are more fails related to this investigation, send the next failed analysis to the investigation screen. This fail will be listed in the Investigation Detail (lower) box. Make sure to send the initial analysis listed in the upper box in the Investigation Screen to the WO for each retest.
How to set up a sample.
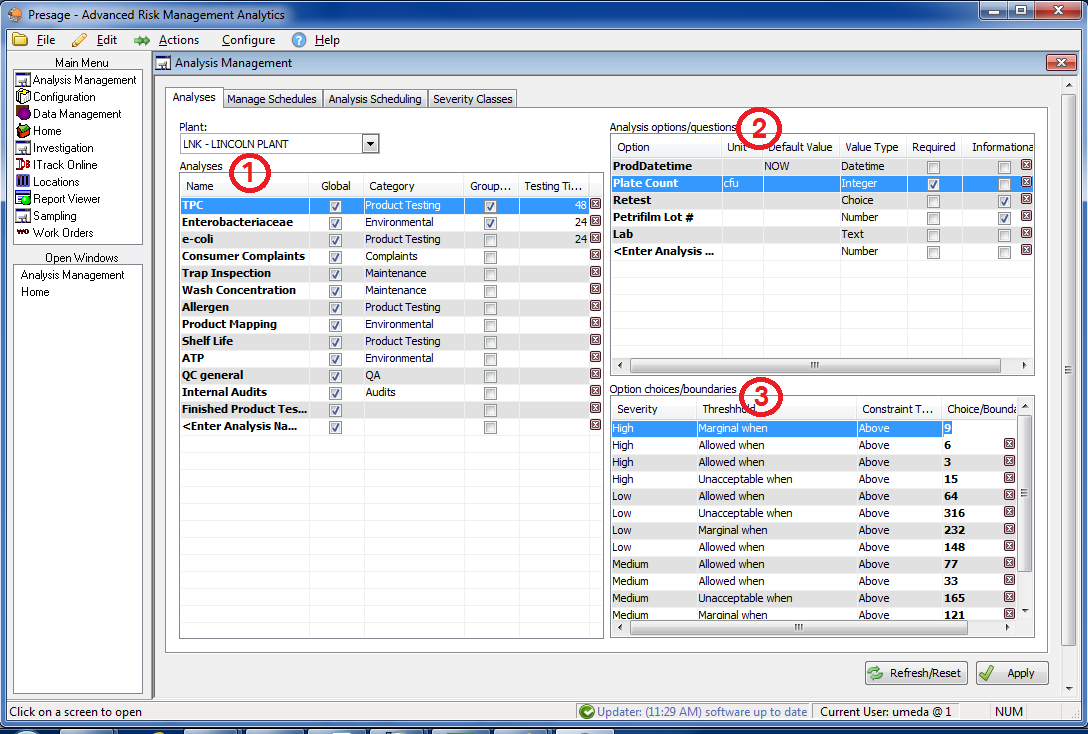
1) Click on Analysis Management under the Main menu. Stay on the first tab Analyses.
2) To create a new analysis, click on the box <Enter Analysis Name>. Enter the analysis name on the box provided. In the next column, type in the category name. This column is used to group analyses. Testing Time is for lab use. Type in the number hours the sample must rest in the incubator.
3) Under Option, enter what is being tested for; for example: production date and time, plate count, Lot#, etc.
When appropriate, enter the unit in the next column; for example: cfu, ppm, etc.
The Informational box is for options which don't need to be graphed. Check if appropriate.
Then choose the Value Type from the drop-down list provided. For example, plate count is measured in number, and qualitative analyses are measured in boolean: positive or negative. To create a drop-down list of various options to select from, choose Choice.
An analysis disappeared from Analyses screen, and I did not delete it.
If an analysis has a global setting, then it is used by all plants within a company. If one plant unchecks the global setting, then the analysis is hidden for all other plants except for the plant that set the analysis to be plant-specific.
Note: This does not mean the analysis and all data attached to it is deleted for all other plants. It is simply hidden.
Make sure another plant has not unchecked the global setting in the Analysis Management-Analyses screen.
If not, call the customer support rep at 1.800.309.1704.
How to set up a threshold.
1) Click on Analysis Management under the Main Menu. Stay on the first tab Analyses.
2) Select an analysis and a specific option you want to set thresholds or specifications to. Set thresholds for each option separately.
3) Select the severity from the drop-down list. To set up severity classes, refer to Analysis Management: Severity Classes.
4) For Threshold, select an option from the drop-down list. Marginal values are those which are acceptable, but are nearing the unacceptable boundary. Unacceptable values represent failure. Invalid values signify an error.
5) Constraint Type sets the minimum and maximum boundary value.
6) Choose the appropriate Choice/Boundary Value, or fill it in manually. For example, to set 10 cfu as a maximum acceptable limit for an analysis, choose Unacceptable when under Thresholds; Above under Constraint Type; and type in 10 under Choice/Boundary.
7) Click Apply to save changes.
How to make thresholds plant-specific for global analyses.
Select a plant-specific Severity or Product with each threshold and make sure the Global box is not checked.
How to set up a schedule.
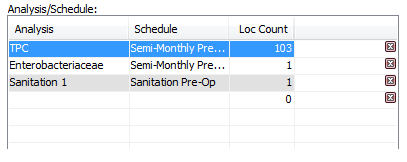
1) First select the plant from the drop-down list.
2) Under the column title Analysis, select the analysis type from the drop-down list. This list includes all analyses created under Analysis Management: Analyses.
3) Select the schedule period interval from the drop-down list under Schedule. This list is created under Analysis Management: Manage Schedules.
4) The Location Count is automatically filled out when the locations are selected in the next step.
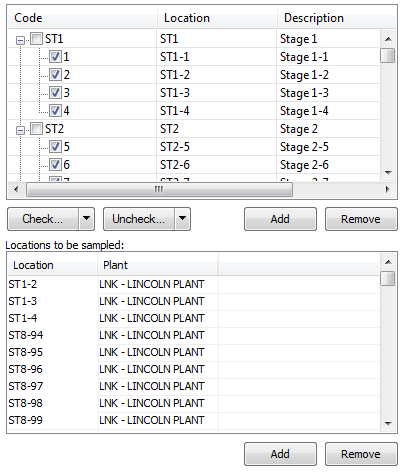
5) The right side of the screen is for choosing locations to perform the analyses on. Select one analysis under Analysis/Schedule:. Then check the box next to the locations which need to be sampled.
6) For a quick look-up, type in the first letter or number of the display code for the location. The corresponding locations will show up in the display below. The list can also be filtered by severity class. Choose the severity class from the drop-down; the list in the display will narrow down to locations with the severity class specified.
7) Use the Check... button to select groups of locations. Use the Uncheck... button to deselect groups of locations. Click Add (on the middle of the screen, not the one on the lower portion of the screen) to add the selected locations to the list of locations to be sampled. Click Remove to take out locations from the list.
8) To add locations one at a time, use the Add button on the lower portion of the screen under Locations to be sampled:. To remove a location, select a location from the list and click Remove. To remove multiple locations, hold down the Ctrl button on keyboard while selecting multiple locations, then click Remove.
9)Click Apply to save any changes and use the Refresh/Reset button to remove any unsaved changes.
How to set up a severity/proximity/zone matrix.
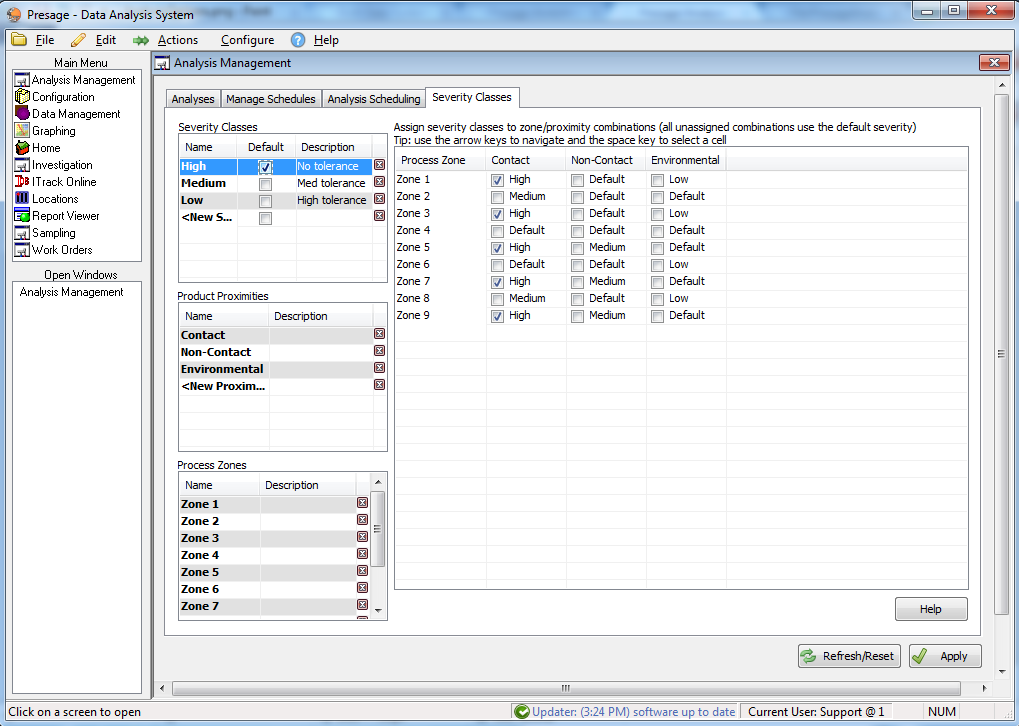
1) Click Analysis Management under the Main Menu.
2) Click Severity Classes.
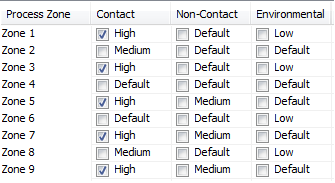
3) Give a unique names to all severity classes. Severity classes are based on limits which are set based on product proximities and process zones. Examples are High, Medium, and Low; or 10, 100, 500. Use terminology or numbers which best fit your system.
4) Click on the box under Default (may have to expand the column to see the full column title), to set a default. Default severity class is usually the one used the most often.
5) Product proximity refers to contact or non-contact surfaces. To add new product proximities, click on <New Proximity>. Type in the new proximity title. To remove product proximity, click on the red box with a white X to the right of each line. To rename, select the appropriate row and type in the new proximity name.
6) Process zones are different operational zones such as Chilling or Packaging. To add new zones, click on <New Zone> (It may be necessary to scroll down to see this row.) To delete a zone, click on the red box with white X to the right of each line. To rename, select the appropriate row and type in the new zone name.
7) To assign severity classes to zone/proximity combinations, click on one severity class under Severity Classes on the left display to highlight it, then check the boxes where the selected severity class is appropriate on the right display.
8) Now, click the next severity class to highlight it, then check the boxes where this severity class is appropriate on the right display. Not all boxes have to be checked.
9) Click Apply to save the changes.
Not able to mark a threshold as 'Global'.
To be able to mark a threshold or thresholds 'Global', no specific Severity or Product must be selected. All Severities must be selected under Severity and All Products must be selected under Product for each specific threshold (each row) for it to be able to be 'Global'.
How to add a plant.
1) Click Configuration under the Main Menu.
2) Click Plants.
3) Click New Plant.
4) For Plan #, select New from the drop-down list.
5) If the new plant is private, check the box provided. With this option, users must log in to have access to the new plant.
6) The Display Code will appear in the Plant # drop-down list after the new plant has been created. Choose a unique code which will best identify the plant.
7) Company Name refers to the business name a particular plant is associated with.
6) Fill in all information in the spaces provided.
How to delete a plant.
1) Click Configuration under the Main Menu.
2) Click Plants.
3) To delete a plant, choose the plant from the Plant # drop-down list.
4) Click Delete Plant.
How to add a user.
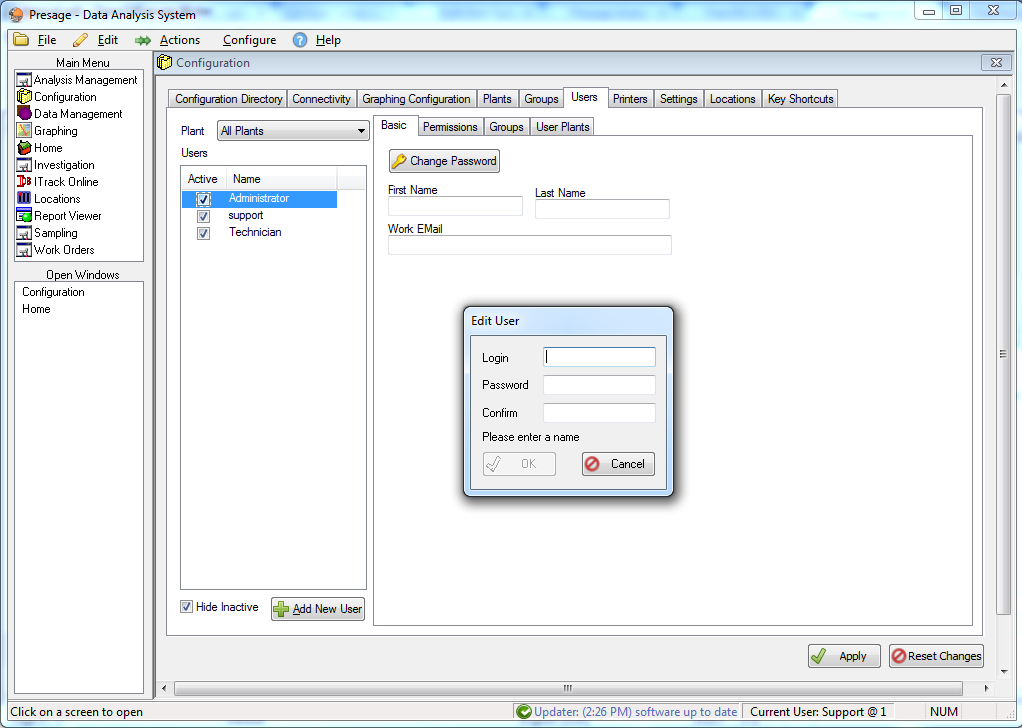
1) Click Configuration under the Main Menu.
2) Click Users.
3) Click Add User.
4) Enter login name and password, and re-enter password to confirm in the pop-up box.
5) Click OK.
Note: Password is case sensitive, but the username is NOT case sensitive. Choose a password that is easy to remember but difficult for others to guess. A good password has a combination of both letters and numbers.
How to delete a user.
In Presage, there is no way to completely delete a user, however users can be inactivated and hidden from the users list.
1) Click Configuration under the Main Menu.
2) Click Users.
3) Uncheck the box next to the users' names.
4) Check Hide Inactive box to take inactive users out of the users list.
How to change a user password.
1) Click Configuration under the Main Menu.
2) Click Users.
3) Select the username.
4) Click Change Password under the Basic Tab.
5) Enter and re-enter password.
Note: Password is case sensitive. Choose a password that is easy to remember but difficult for others to guess. A good password has a combination of both letters and numbers.
How to create groups.
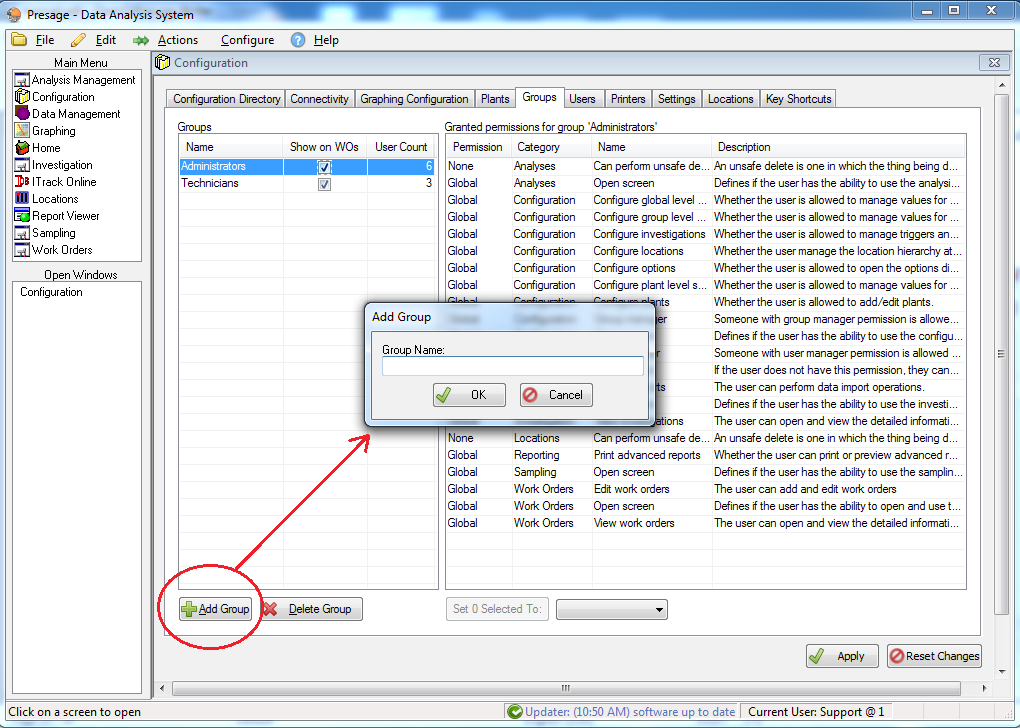
1) Click on Configuration under the Main Menu.
2) click on the Groups tab.
3) Click Add Group.
4) Type in the new group name.
5) Click OK, then Apply.
6) Check the box under Show on WOs, if this group will perform tasks in the work orders.
User Count shows the number of users in the group.
How to set permissions to groups.
1) Click on Configuration under the Main Menu.
2) Click on the Groups tab.
Permission settings are none (not permissible), plant (permissible only for this plant), and global (permissible for every plant).
3) Scroll to the right to see complete descriptions for each permission.
4) Click on the group name to highlight it.
5a) To change permission levels individually for each category, click on each row in the Grant column, a drop-down list of permission levels will appear. Make a selection.
5b) To change permissions for multiple categories at once, hold down the Ctrl key on the keyboard and select desired rows. The first button directly below the permissions list will update the number of rows selected. Click on the blank button next to it, a drop-down list with permission levels will appear. Make a selection, then click the updated Set # Selected To: button to left of it.
6) Click Apply to save changes.
Note: Users get the greater of user or group permission levels. For example, if the user is assigned global level to permission X, but the group they belong to has plant level to permission X, then that user gets the global level for permission X.
How to assign users to groups.
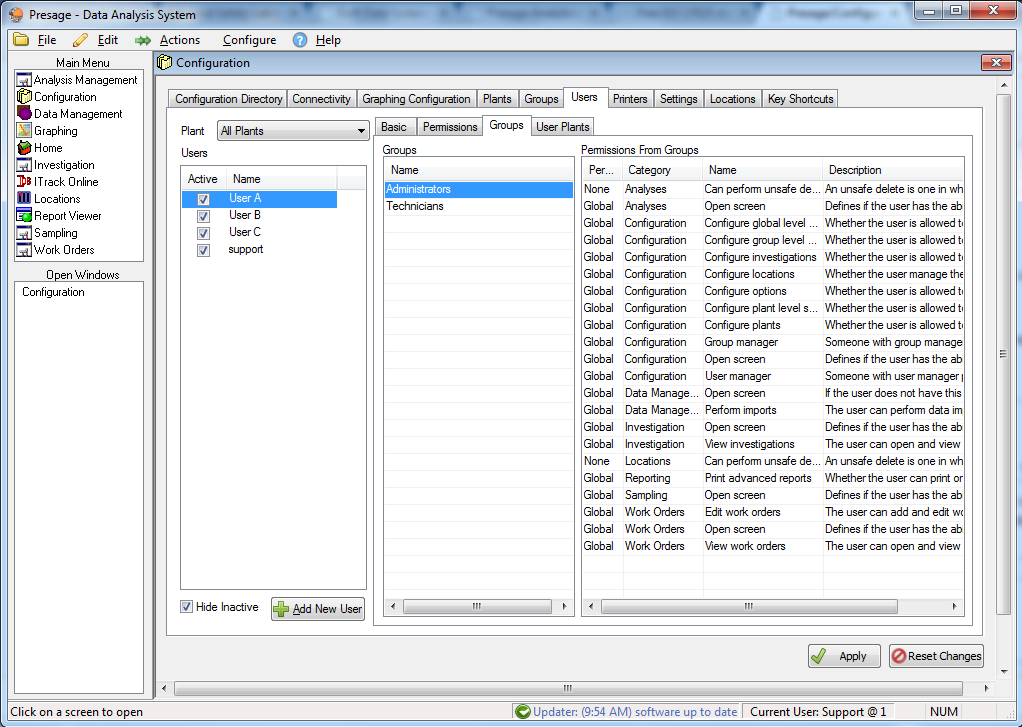
1) Click on Configuration under the Main Menu Then click on the Users tab.
2) Click on Groups which is the third sub-tab under the Users tab.
3) Click on the user's name to highlight it, then click on the group name.
4) Click Apply.
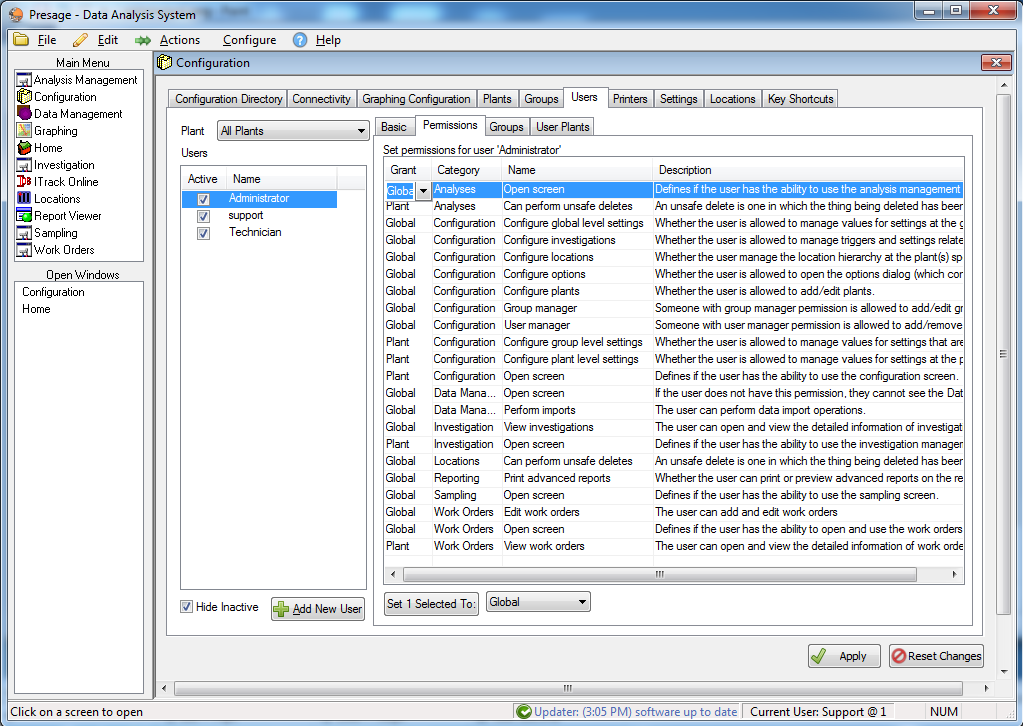
How to set permission for each user.
Go to Configuration, then Users.
Click on the user's name to highlight it, then click on Permissions sub-tab.
To change permission settings individually for each category, click on each row in the Grant column, a drop-down list of permission settings will appear. Make the desired selection.
Permission settings are none (not permissible), plant (permissible only for this plant), and global (permissible for every plant).
Scroll to the right to see complete descriptions for each permission.
Click Apply to save changes.
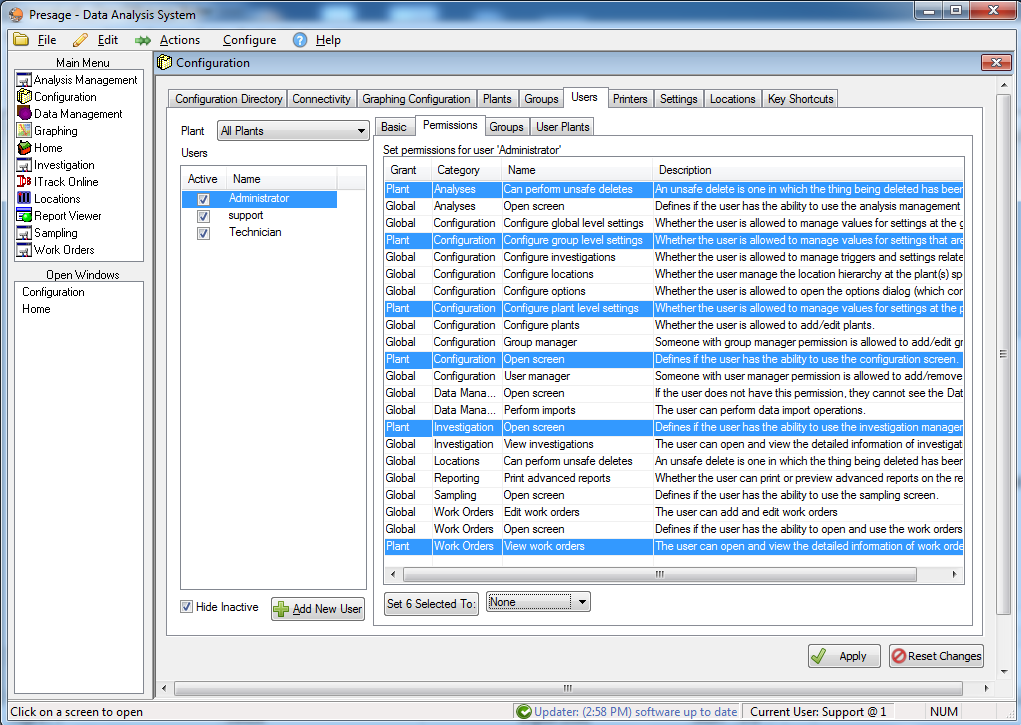
To change permissions for multiple categories at once, hold down the Ctrl key and select desired rows or Ctrl-A to select all.
The first button directly below the permissions list will update the number of rows selected. Click on the second button, a drop-down list with permission settings will appear. Make the desired selection, then click the updated Set # Selected To: button to left of it.
Click Apply to save changes.
User's user permission is different from his/her group permission.
In this case, the user is given the best of both permission levels. For example, if the user permission for deleting data is set to plant-level and the group (which the user is assigned to) permission for the same task is set to global-level, then the user gets the global permission.
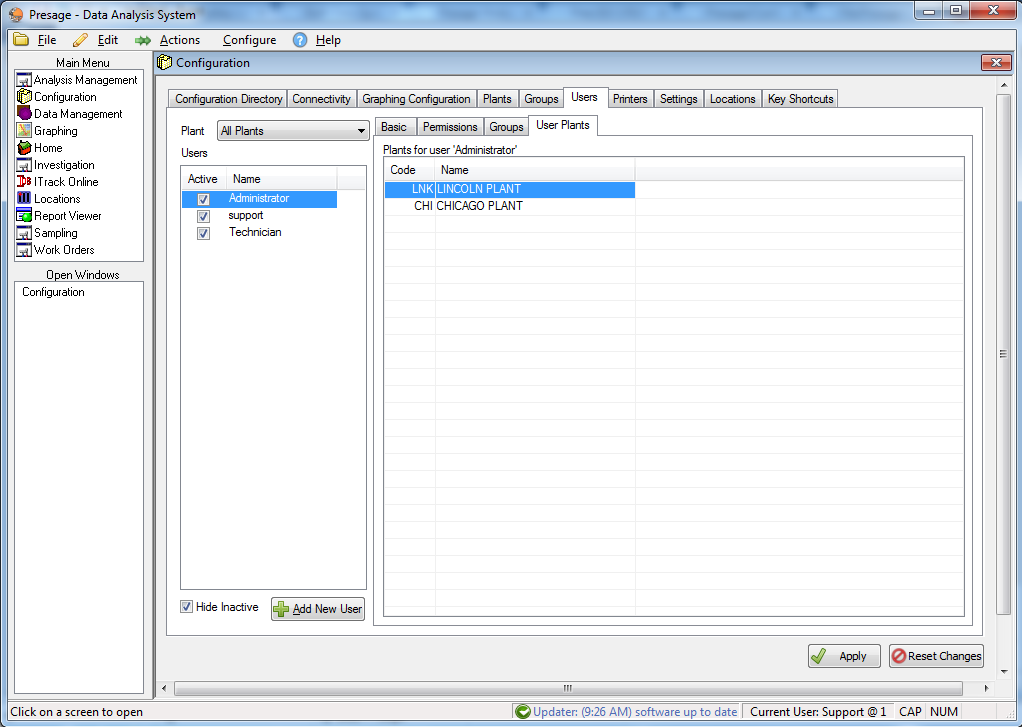
How to assign users to plants.
1) Click on Configuration under the Main Menu.
2) Click Users tab then User Plants sub-tab.
3) Click on the user name, then select the plant name(s).
4) Click Apply.
How to configure printer settings.
1) Click on Configuration under the Main Menu.
2) Click on the Printers tab.
3) Report Type drop-down list includes reports with various dimensions used by the plant. Select one.
4) Printer Name is the printer name (identification code) used to print the report. Select the appropriate printer used for the report dimensions selected.
The Driver and Port information will be filled automatically.
5) Click Apply.
If there are multiple report types, follow the steps above to attach a report type to a printer name.
Click Apply after each setting.
How to print labels.
After adding all the samples in the work order, check the appropriate &Print box. Then click Save.
&Print prints letter size reports. &Print Tags has two options: with Barcode and without Barcode. Usually it's a 1.1 inch x 2.4 inch label, but it can be customized to your needs. &Print Test Tags prints very thin labels with barcodes. These are meant for sticking on petri dishes and petri films.
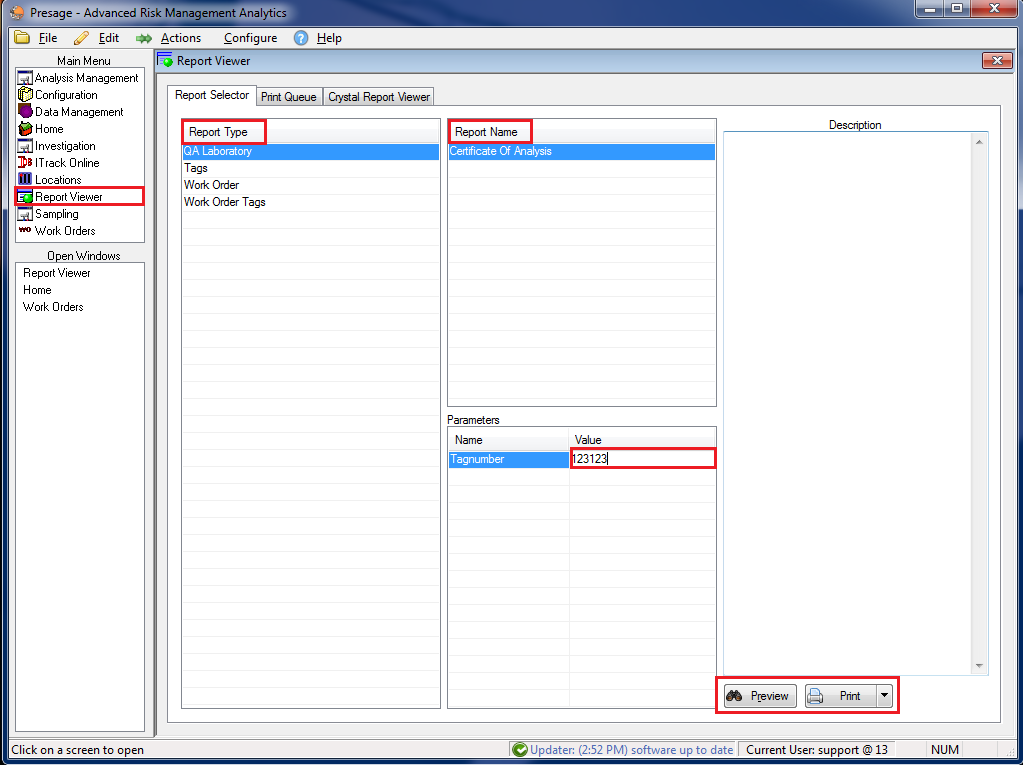
How to print a report.
1. Click Report Viewer under Main Menu.
2. Select the report type.
3. Select the report name.
4. Enter a parameter value next to the parameter name listed.
5. Click Preview to view the report, or click Print.
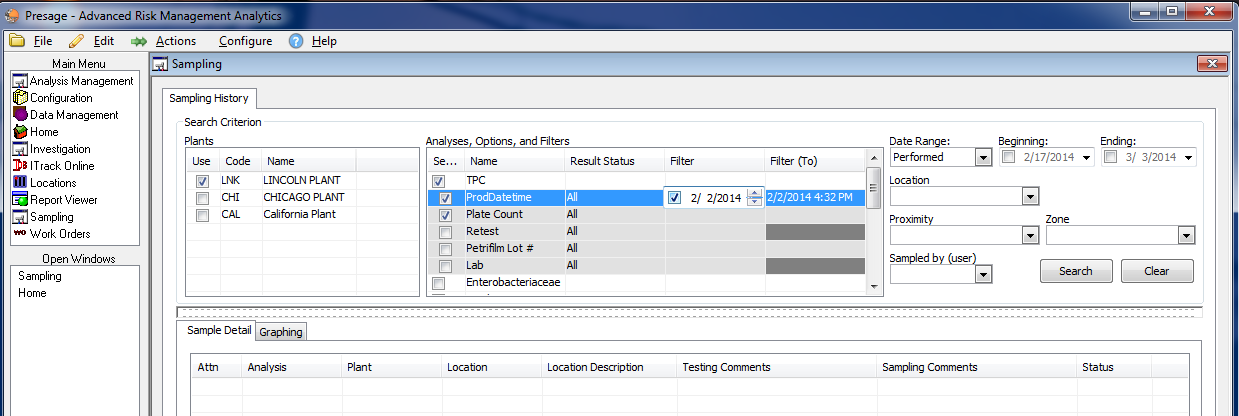
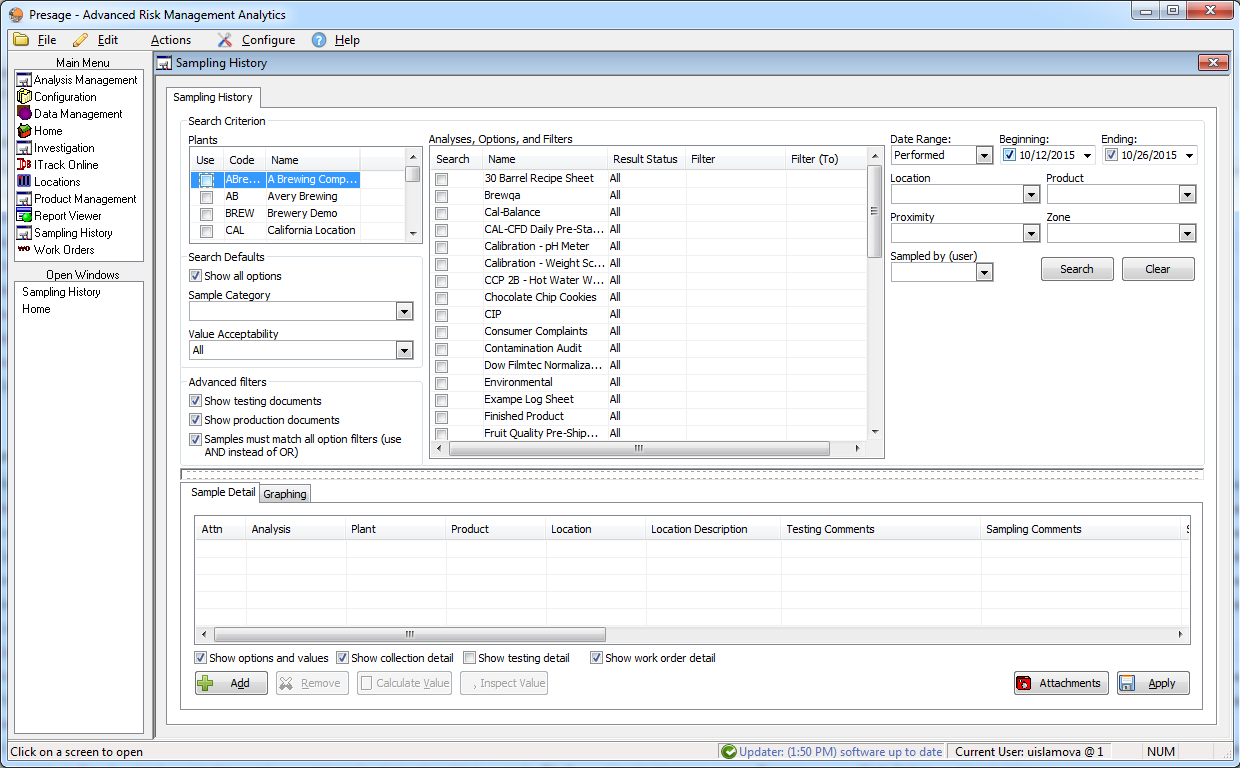
How to narrow down history search using option filters.
1. Click Sampling under Main Menu.
2. Check the box next to the plant you want to pull up data on.
3. Check the box next to the analysis you want to search for.
4. Check the box next to the option you want to search for.
5. Click on the field under Result Status and select a status from the list to narrow down search to a specific result status.
6. Click on the field under Filter to type in or select a value to narrow down search. If the option is set up to be a choice, this field will be a choice. If the option is set up to be a date, then select an appropriate date. If the option is set up to be a number, type in a number to filter.
7. Make appropriate Date Range, Location, Proximity, Zone, and User selections.
8. Click Search.
9. Data will appear under the Sample Detail tab.
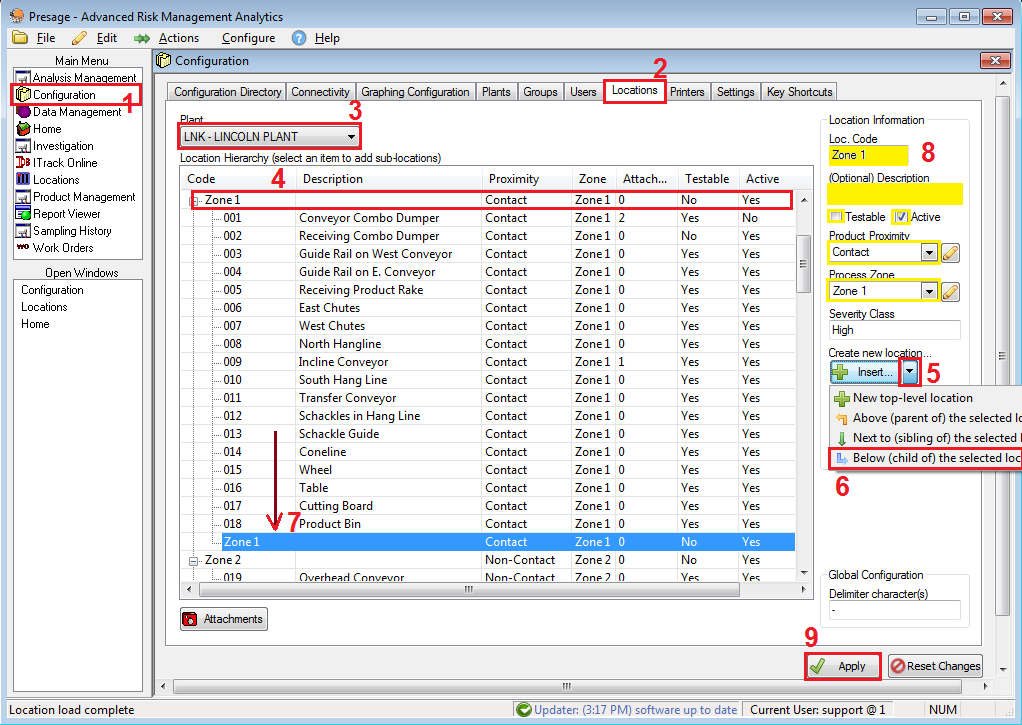
How to add locations.
To add locations or make changes to the location hierarchy, first select the appropriate plant from the Plant drop-down list.
1. Click Configuration under the Main Menu.
2. Click Locations tab.
3. Make sure the correct plant is selected.
4. Select an existing top location.
5. Click the down-arrow next to the Insert button.
6. Select a position (which applies to the location selected in step 4).
7. New location appears on the bottom of the list.
8. The Location Information is pre-filled with the selected location's (in step 4) information. Enter the correct Loc Code, Location Description, Proximity, and Zone. Make sure to check the Testable and Active boxes when appropriate. The Severity Class is filled automatically based on the process zone selected.
9. Click Apply.
How to delete locations.
1. Click Configuration under the Main Menu.
2. Click Locations tab.
3. Make sure the correct plant is selected.
4. Select an existing location.
5. Click Delete.
6. Pop-up will appear with the number of samples attached to this location. Please note that these samples will be permanently deleted along with the location and will not be replaced.
7. Click Apply.
How to edit locations.
1. Click Configuration under the Main Menu.
2. Click Locations tab.
3. Make sure the correct plant is selected.
4. Select an existing location.
5. Make changes under Location Information.
6. Click Apply.
How to rearrange locations list.
1. Click Configuration under the Main Menu.
2. Click Locations tab.
3. Make sure the correct plant is selected.
4. Select an existing location.
5. Click Cut or Copy.
6. Select the top level location you want to paste the cut or copied location.
7. Click the down-arrow next to the Paste button.
8. Select the position which applies to the selected location in step 6.
9. Location will appear on the bottom of the list.
10. Click Apply.
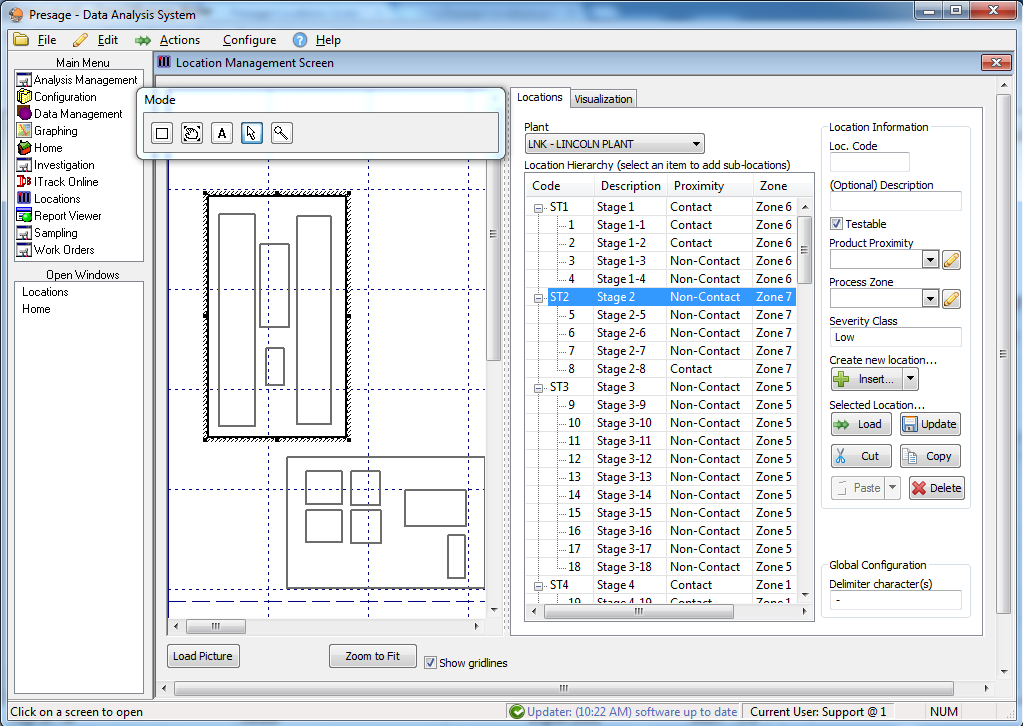
How to create a plant map.
First, select the plant from the Plant drop-down list in the upper right-hand portion of the screen.
To upload a blueprint of the plant, click on Load Picture, locate and select the file, then click Open.
Click Zoom to Fit to make the entire map visible.
Uncheck the Show gridlines box to get rid of the background gridlines.
To map a location, select a location from the Location Hierarchy, then click on the button with a box on the Mode pop-up window. Click and drag cursor to place the box where appropriate. Now, the box and the location identification name are connected, and once the location identification name or code is selected, the coinciding box on the map will be highlighted automatically.
To add text, click on the box with the letter A then click and drag on the canvas to see the cursor appear.
Use the magnifying glass button on the Mode pop-up window to zoom in the picture or diagram.
Use the arrow button to rearrange and re-size boxes. Use the hand button to drag the canvas.
Tip: When several small squares are laid out very close to each other, it is easier to select one particular box by clicking on any box within the group and pressing Tab on keyboard to select other boxes within that area.
For guidelines on Location Information, refer to Configuration: Locations.
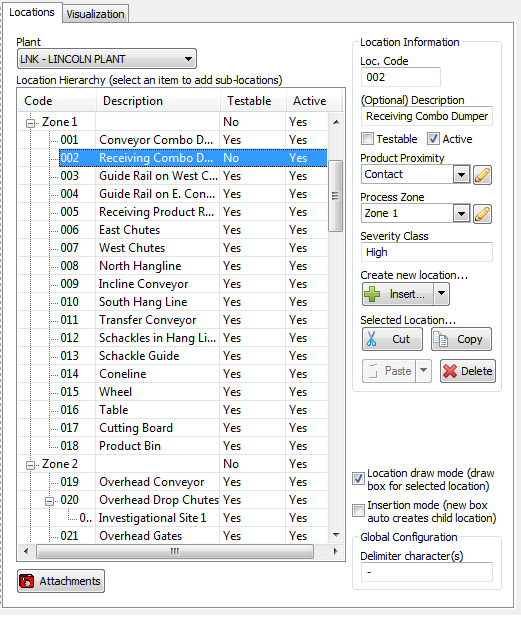
Why aren't my locations listed in the Location drop-down list in the Work Order screen?
When a location is marked as not testable (by unchecking the Testable button under Location Information), that location will not show up in the Location drop-down list in the work order.
Make sure to check the Testable box for all locations that get tested.
For example, in the location below (Loc. Code 002 : Receiving Combo Dumper), the Testable box is unchecked.
Why aren't all my testable locations not showing in the Location drop-down list in the Work Order screen?
The location drop-downs (for speed purposes) only load the first couple hundred items by default. Typing narrows down the list so you can find items that aren't shown.
How to add a product.
1. Click on Product Management under the Main Menu.
2. Select the appropriate plant from the Plant: drop-down menu.
3. Click an existing line in the Product List.
4. Click the down-arrow next to the Add... button.
5. Select an appropriate position for the new product: above, next to, or below.
6. A new selected line appears in the list. Fill in the appropriate fields: Name, Category, Description, and make sure to check the appropriate boxes: Product is in use at the plant and Active Product.
7. Click Apply.
How to delete a product.
1. Click on Product Management under the Main Menu.
2. Select the appropriate plant from the Plant: drop-down menu.
3. Click an existing line in the Product List.
4. Click Delete.
Note: Deleting a product means all data attached to it will also be deleted from the historical samples. An alternative is to inactivate the product.
5. A pop-up appears warning about the above note. Click OK.
6. Click Apply.
How to inactivate a product.
1. Click on Product Management under the Main Menu.
2. Select the appropriate plant from the Plant: drop-down menu.
3. Click an existing line in the Product List.
4. Uncheck the box next to Active Product.
5. Click Apply.
Note: To see this inactivated products, check the box next to Show inactive products directly below the Products tab.
How to assign a product to a plant.
1. Click on Product Management under the Main Menu.
2. Select the appropriate plant from the Plant: drop-down menu.
3. Click an existing line in the Product List.
4. Check the box next to Product is in use at plant "X".
5. Click Apply.
How to attach an image to a product.
1. Click on Product Management under the Main Menu.
2. Select the appropriate plant from the Plant: drop-down menu.
3. Click an existing line in the Product List.
4. Click on the Attachments tab.
5. Click Add.
6. Select an image and click Open on the pop-up.
7. Click Apply.
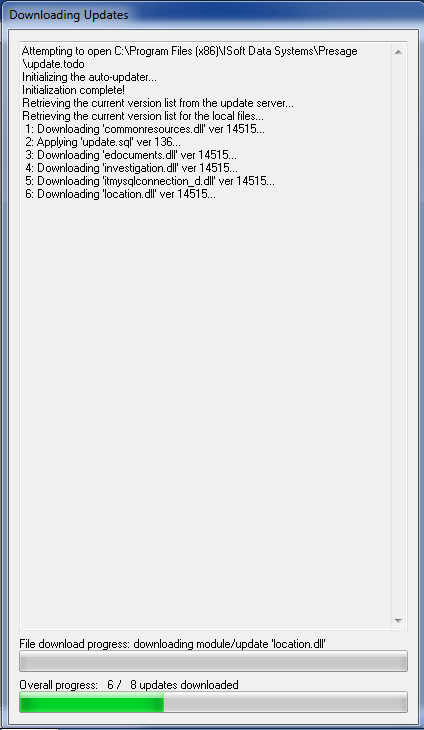
How to apply updates.
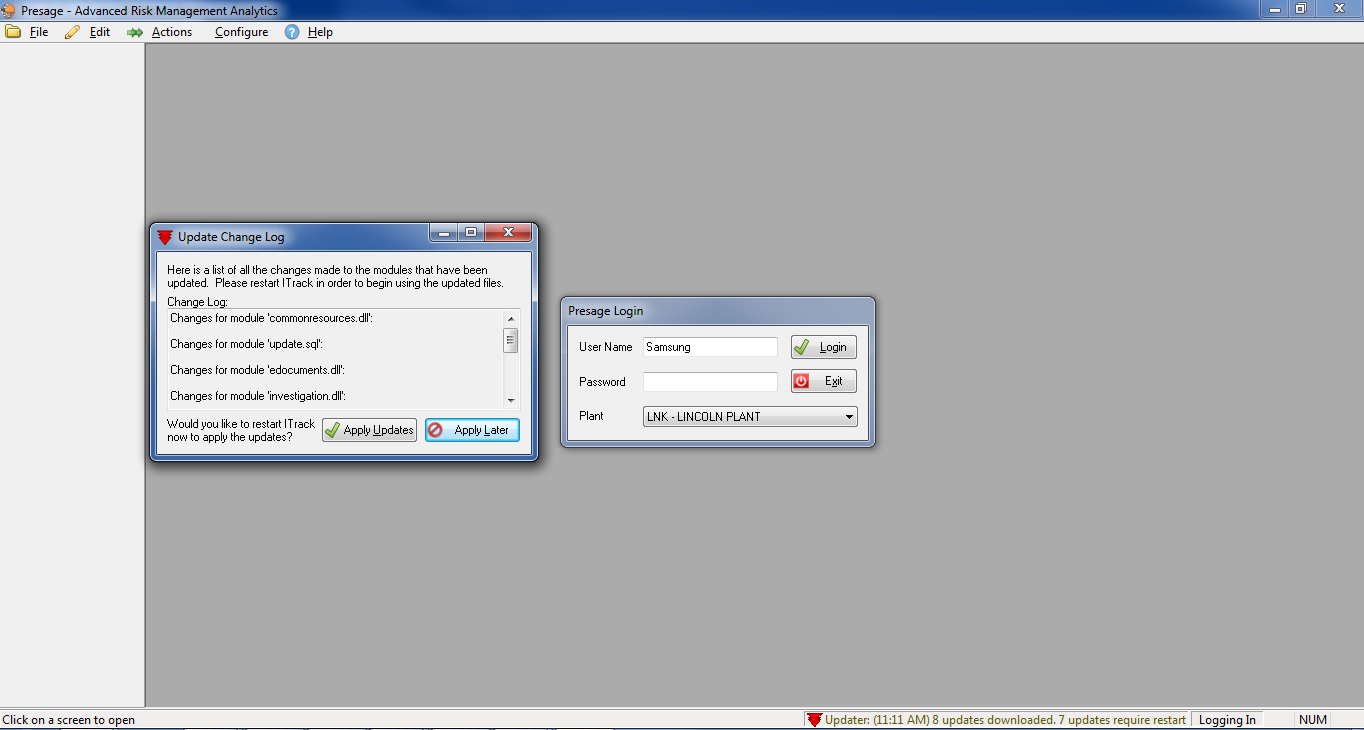
When updates have been released, the following dialog pops-up upon opening the Presage application.
Once the following dialog pops-up, click Apply Updates.
Then click Launch ITrack.
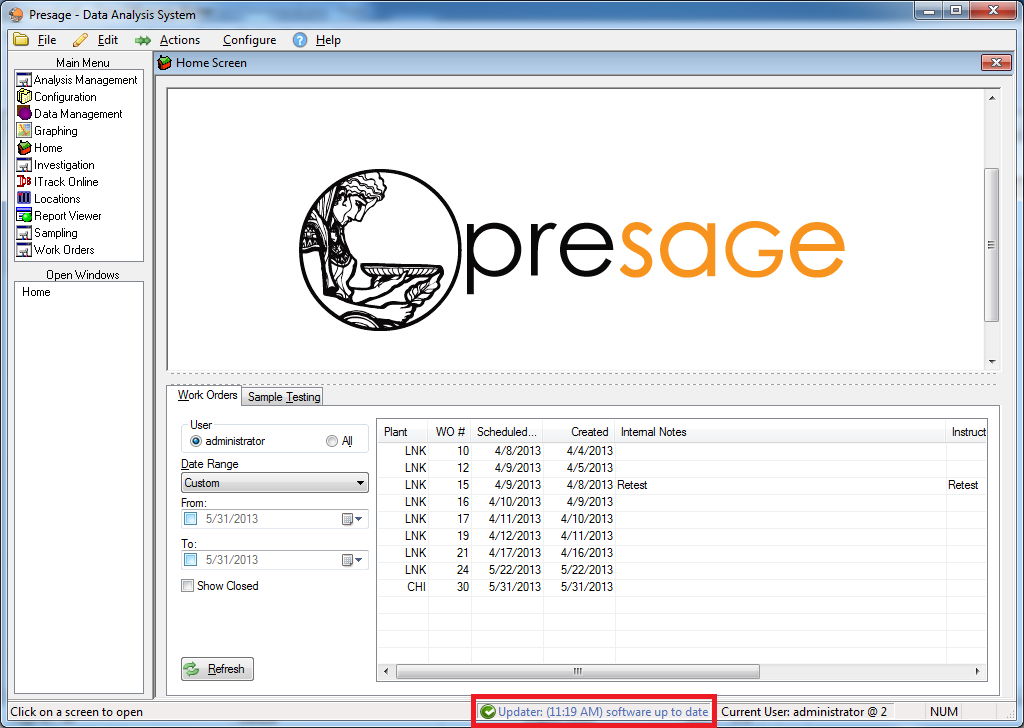
Note: If the updates have not been applied, the notification will appear on the very bottom-right panel of Presage.
Double-click on this notification to start the downloading updates process.
My update finished with errors. What do I do?
1. Reset the updates.
2. If the above does not work, call the Presage customer support at 1.800.309.1704.
Note: Presage can be used even if the updates have not gone through by clicking Close on the update pop-up dialog and logging in as usual.
How to send samples from the Sample Schedule to the work order.
1) Click on Work Orders under the Main Menu.
2) Click on the Sample Schedule tab.
3) Choose a plant from the drop-down menu on the right.
4) Choose the date range to view analyses scheduled for specific dates. For custom date range, select Custom from the drop-down menu. Then set the From: and To: dates from the calendar icon or type it in. Otherwise, leave it to Today.
5a) Select a sample. To select multiple samples, hold on to Ctrl key and select the samples.
5b) For random selection, click Choose Random on the bottom-right corner. Type in number of samples to pull under the Choose column in the appropriate Schedule row.
6) Click Send to WO.
If I add a sample to a work order manually, will it affect the status of the same sample that's in the schedule?
No. If a sample has been added to a work order through the Add button instead of the Send to WO in the Sample Schedule screen, these samples are independent and don't mark the same sample that is scheduled as completed. The scheduled sample will remain in the schedule.
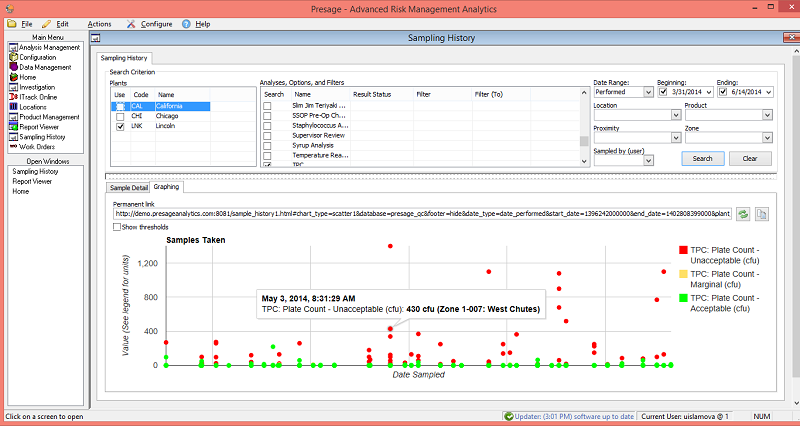
How to view/graph historical data.
1) Click on Sampling under the Main Menu.
2) Stay on the Sample Detail tab to view data in spreadsheet form. Click on the Graph to view data in a scatter graph.
3) Select a plant.
4) Select an analysis name.
5) Check the boxes next to options you want pulled up. Enter filters when needed.
6) Plug in the variables in the boxes provided: date range, plants, location, user, proximity and/or zone.
7) Click Search.
Click on the column title on the table to order the data by a certain criteria. For example, click on the Performed On to see results in chronological order of date performed.
Select and change criteria for the graph using the same panel used for sampling history on the upper portion of the screen.
Hover over points to view details such as date, time, analysis, analysis option, location, etc. This pop-up can be customized.
Hover over a label in the map key to highlight the group of points which belong to that label.
Why isn't an analysis option showing up on my Sampling Graph?
If an option has been checked as Informational, it will not appear in the graph.
How to view sample acceptability status over the plant map.
1) Click on Sampling under the Main Menu.
2) Enter search criteria and pull up historical data.
3) Right-click on one of the rows. A dialog with multiple options pops-up. Click send all # results to the locations screen for visualization.
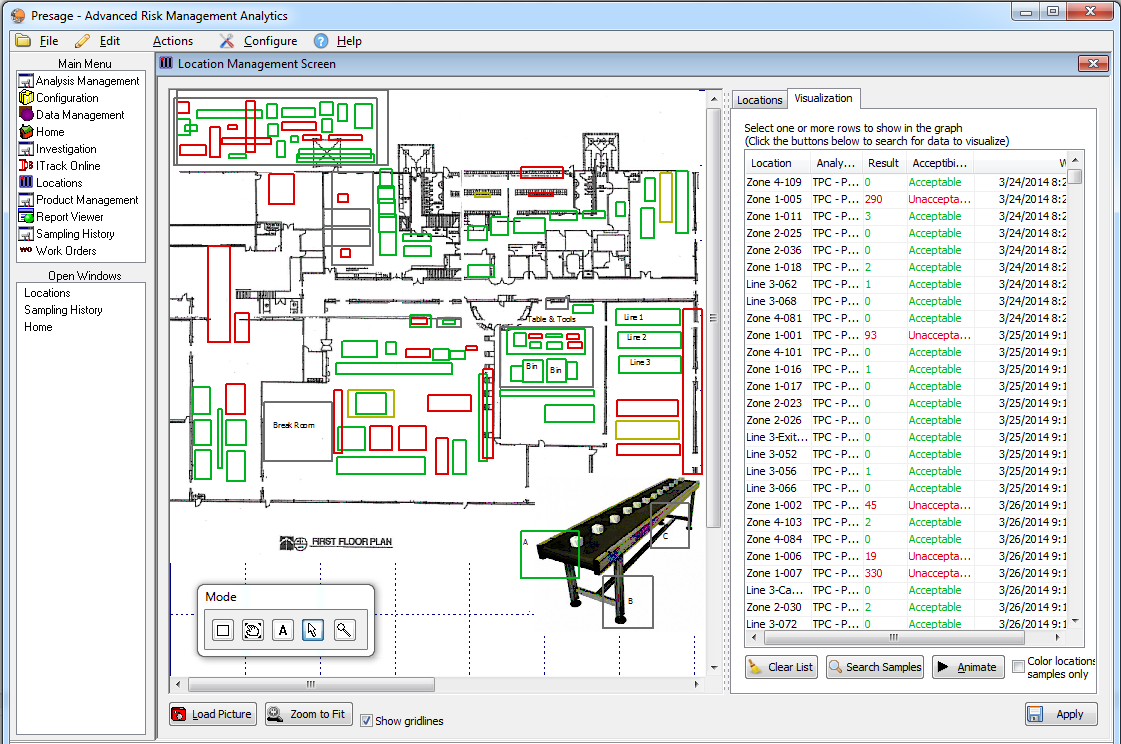
A new screen opens up. This is the Visualization tab under Locations Screen.
On the left display, locations are highlighted in green and red. Green locations are ones with acceptable counts, and red locations are ones with fail counts.
Highlight a row on the right and the corresponding location will be highlighted automatically on the left display and vice versa.
Order the Date Sampled column by clicking on the column title When. Click the first row and press the down-arrow on the keyboard to see a play-through of where the samples were taken in a chronological order.
Note: Every row can be ordered by clicking the column title.
Check the box Color locations based on selected samples only, and select a group of rows to see the colors only for those selected.
Part of data not being sent to plant map.
The number of samples transferred to the plant map will depend on the number of items listed in the first page of Sampling History. By default, this screen lists 1000 items. If there are more than 1000 samples, there will appear two arrows (one pointing to the left and one to the right) with the text Next 1000 Samples on the bottom of the screen.
To increase the limit on number of items to show in this list, click on Configuration under the Main Menu, then Settings.
Click Sampling under the Category list, and type in 10,000 (more or less) under the Value (second column).
Click Apply.
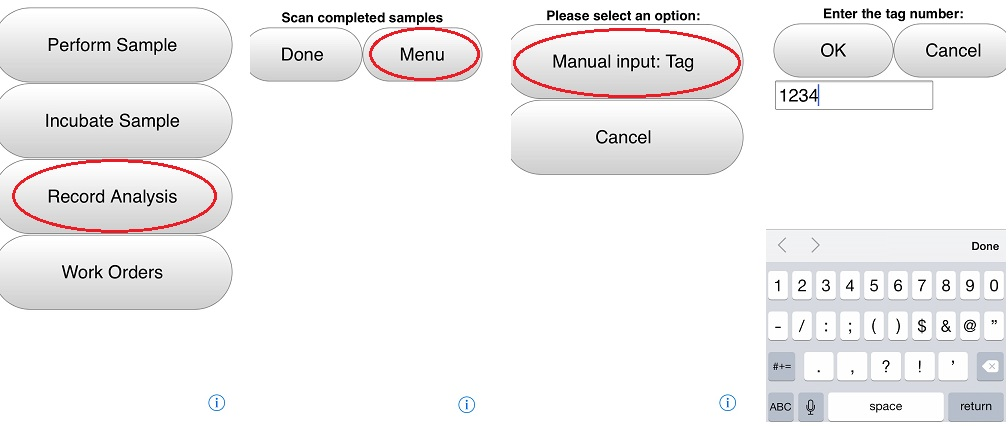
How to pull up a sample on the scanner without scanning a barcode.
1) Press Record Analysis.
2) Press Menu.
3) Press Manual Input: Tag.
4) Type in the Tag# in the field provided.
5) Press OK.
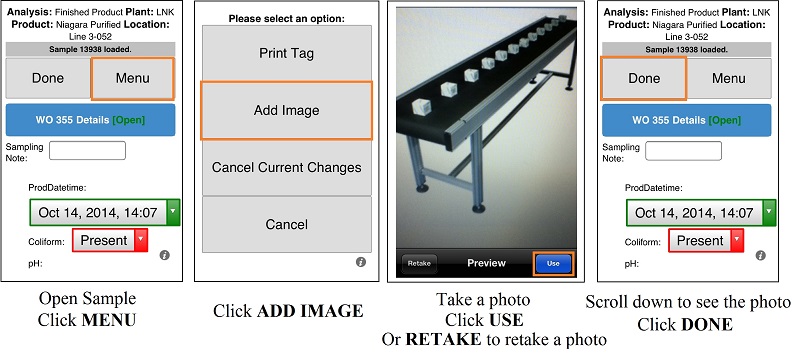
How to add images to a sample on the scanner.
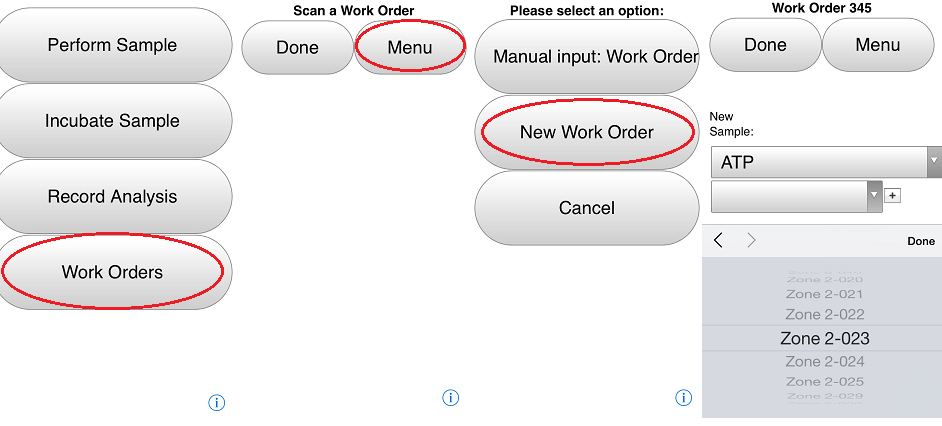
How to create a work order on the scanner.
1) Press Work Orders in the main menu on the scanner.
2) Press Menu.
3) Press New Work Order.
4) Tap on the first empty box and select an analysis name.
5) Tap on the second empty box and select a location name.
6) Press Done on the scroll pop-up.
7) Press +. Wait for the newly added sample to appear on the top of the selection area.
8) Repeat steps 4, 5, 6, and 7 for each sample.
9) Press Done.
10) Repeat all the steps for each new work order.
How to add a sample to an existing work order.
1) Press Work Orders in the main menu on the scanner.
2) a. Scan work order barcode.
2) b. Press Menu, Manual input: Work Order, type in work order number.
3) Tap on the first empty box and select an analysis name.
4) Tap on the second empty box and select a location name.
5) Press Done on the scroll pop-up.
6) Press +. Wait for the newly added sample to appear on the top of the selection area.
7) Press Done.
What do the result status colors mean on the scanner?
Black = Not Calculated or Error
Red = Unacceptable (out of spec)
Orange = Warning
Green = Acceptable (within spec)
How to change the date range(reduce clutter) in the work order queue.
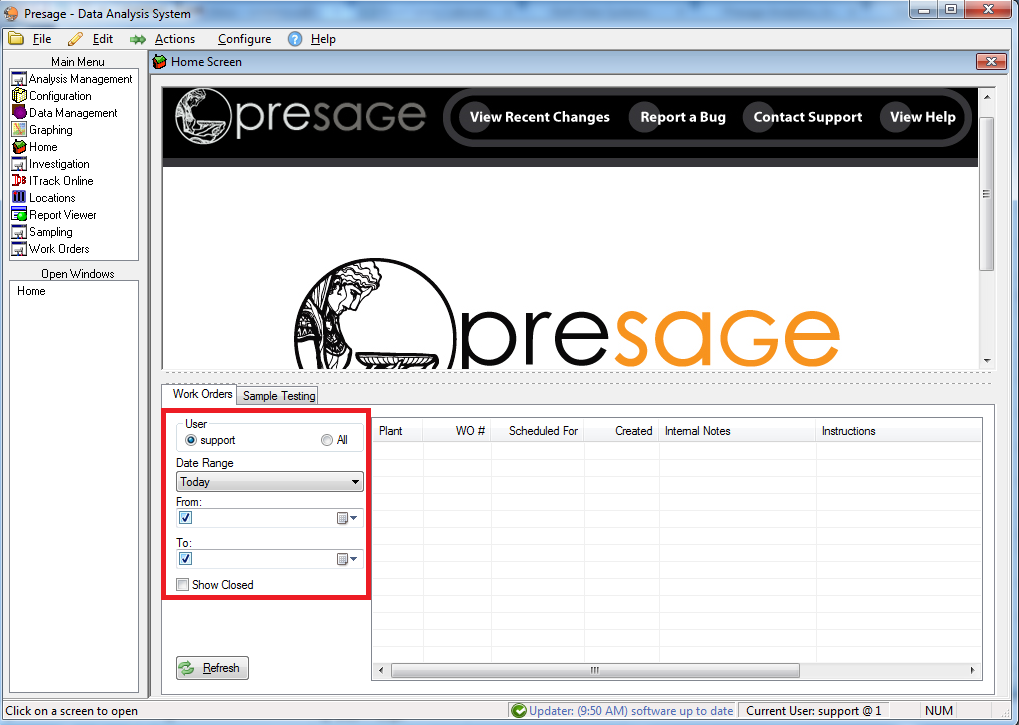
There is a menu to the left of the display panel in the Work Orders tab.
User is the login user. Make sure to check this box instead of All to see work orders specific to you.
Date Range drop-down list shows time periods during which work orders were assigned. For example, selecting “Last Month” will list all work orders created in the previous month. There is an option to set the date range to Custom. For this option, users can set a date range by specifying the start and end date. To the right of the date box is a calendar icon for easier date selection.
Select the plant from the drop-down to narrow down the work order list to one plant.
By checking the Show Closed box, users can view all completed and pending work orders within the date range set.
The laser is not working on the Linea Pro.
Sometimes when the application is running for a long time, it needs to be restarted.
1) Double-click on the Home button on the iPod. The only button on the face of the iPod.
2) Swipe the ITrackLX app up to remove it from history.
3) Press on the ITrack LX app from the home screen and resume with logging in.
Most often the above steps will fix the laser, if not try the following:
Detach the iPod from the Linea Pro, then reattach.
Recently created work order is not showing in the Home Screen queue.
Click Refresh in the Home Screen to the left of the work order queue to see the new work order.
How to reorder columns in the work order screen.
There are two types of columns in the work order screen: constant columns and analysis option columns. The Constant Columns are those columns which are always the same in the work order screen: Attn, Analysis, Locations, Tag#, Sampling Comments, Testing Comments, Performed On, Performed By, etc. The Analysis Option Columns are those columns which are set up in the Analysis Management screen for each sample.
In the work order screen, click & drag the column header to where you like to place the column. The blue vertical line is an indicator of where the column will be dropped if you let go of the click.
Note: Analysis option columns are always placed after the Locations column. If you would like to move one of the Constant or non-analysis option columns from the very right of the work order screen to the beginning of the work order, make sure to place the columns before the Locations column to save the new order. If you place the column right after the Locations column, this order will not be saved as the analysis option columns will go in between the Locations column and the other column.
How to change ordering of analysis options in the work order screen.
There are two types of columns in the work order screen: constant columns and analysis option columns. The Constant Columns are those columns which are always the same in the work order screen: Attn, Analysis, Locations, Tag#, Sampling Comments, Testing Comments, Performed On, Performed By, etc. The Analysis Option Columns are those columns which are set up in the Analysis Management screen for each sample.
The analysis option ordering is managed in the Analysis Management screen under the Main Menu.
Click on the Analysis Name.
Click, drag, and drop the option name where you like it to go. The bold black line indicates where the option will be dropped.
How to change time or datetime fields to military format.
Presage uses the Windows User Locale settings to figure out what format to display/edit times and datetimes in. To do this, change the windows date/time display format, and Presage will follow suit.
1) Click Start or the Windows button on the lower-left.
2) Click Control Panel.
3) Click Clock, Language, and Region.
4) Click Change the date, time, or number format under Region and Language.
5) Set Short time: as HH:mm and the Long time: as HH:mm:ss.
6) Click Apply, then OK.
7) Now reopen Presage.
Part of data not exported to the .csv file.
The number of samples exported will depend on the number of items listed in the first page of Sampling History. By default, this screen lists 1000 items. If there are more than 1000 samples, there will appear two arrows (one pointing to the left and one to the right) with the text Next 1000 Samples on the bottom of the screen.
To increase the limit on number of items to show in this list, click on Configuration under the Main Menu, then Settings.
Click Sampling under the Category list, and type in 10,000 (more or less) under the Value (second column).
Click Apply.
How to Fix Overlapping in Presage Screens
ITrack and Presage are formatted to have the default text size used, if a different text size is set on the computer then you will need to change the text size to 100%:
Changing DPI
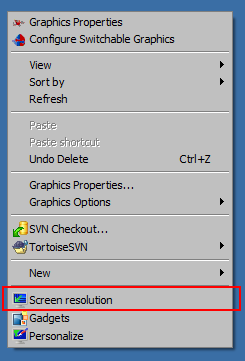
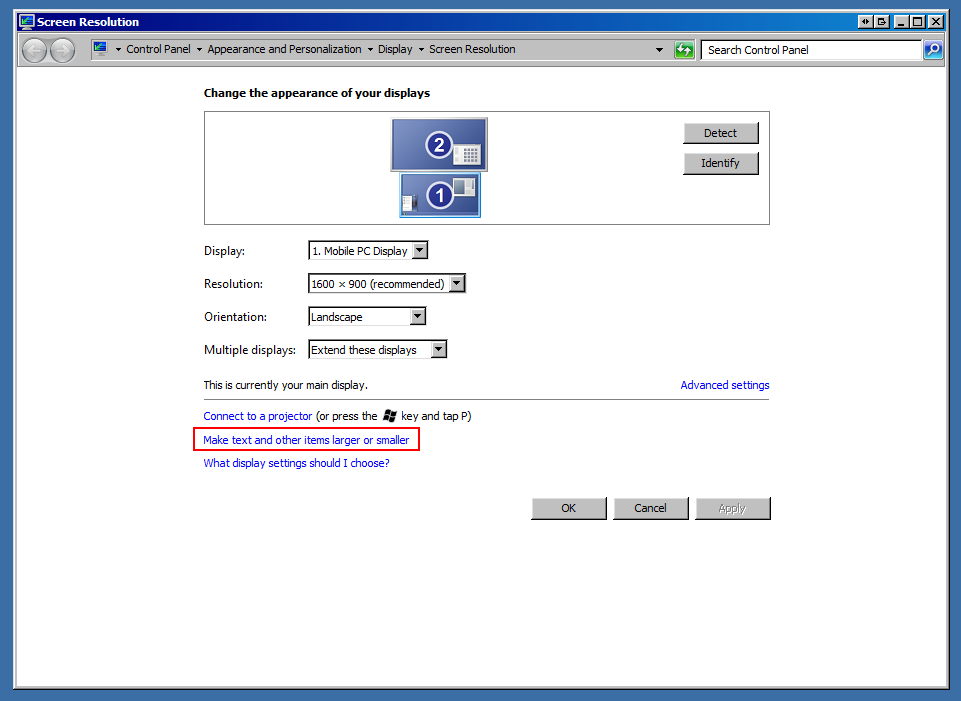
On your Windows Desktop right-click on an open area of the screen. A menu will appear, please select the 'Screen resolution' option.
This will cause a window to pop up. Click on the 'Make text and other items larger or smaller' and a new set of options will appear in the window.
Select the 'Smaller - 100% (default)' option and click the 'Apply' button.
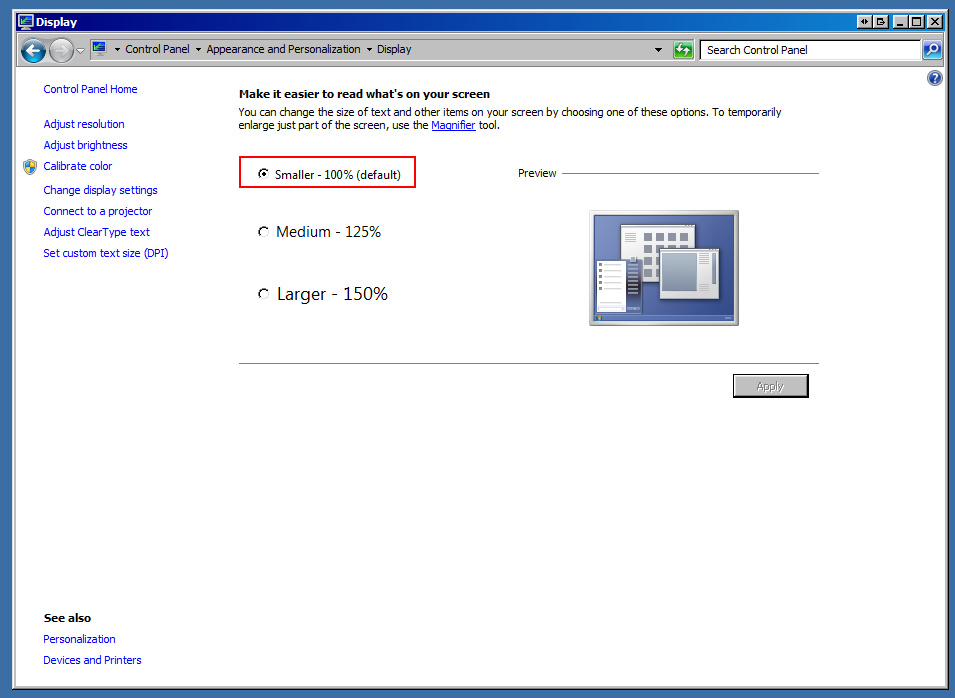
You will need to log out of your Windows User and log back in for the changes to take effect.
Changing Screen Resolution
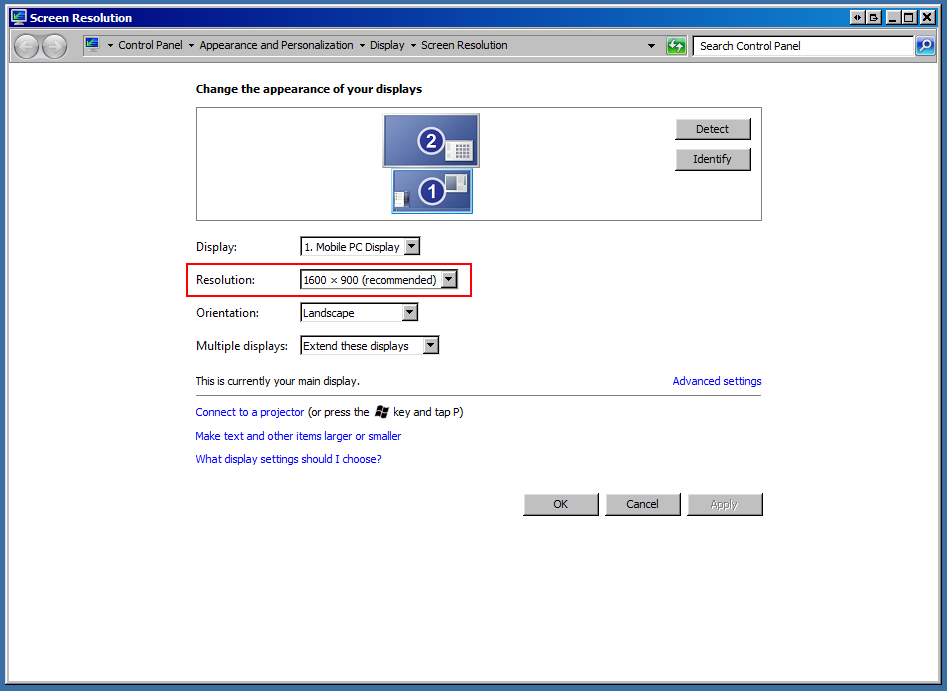
After changing the DPI on a computer, the user may find the text and icons too small, in that case you will need to adjust the screen resolution, which is similar yet distinct from the DPI of the computer.
To adjust the screen resolution, right-click on an open area of the Desktop and you will see the menu appear again. Select 'Screen Resolution' as before, but once the window pops up click on the 'Resolution' drop down and adjust that until the user finds a suitable size for their icons and text.
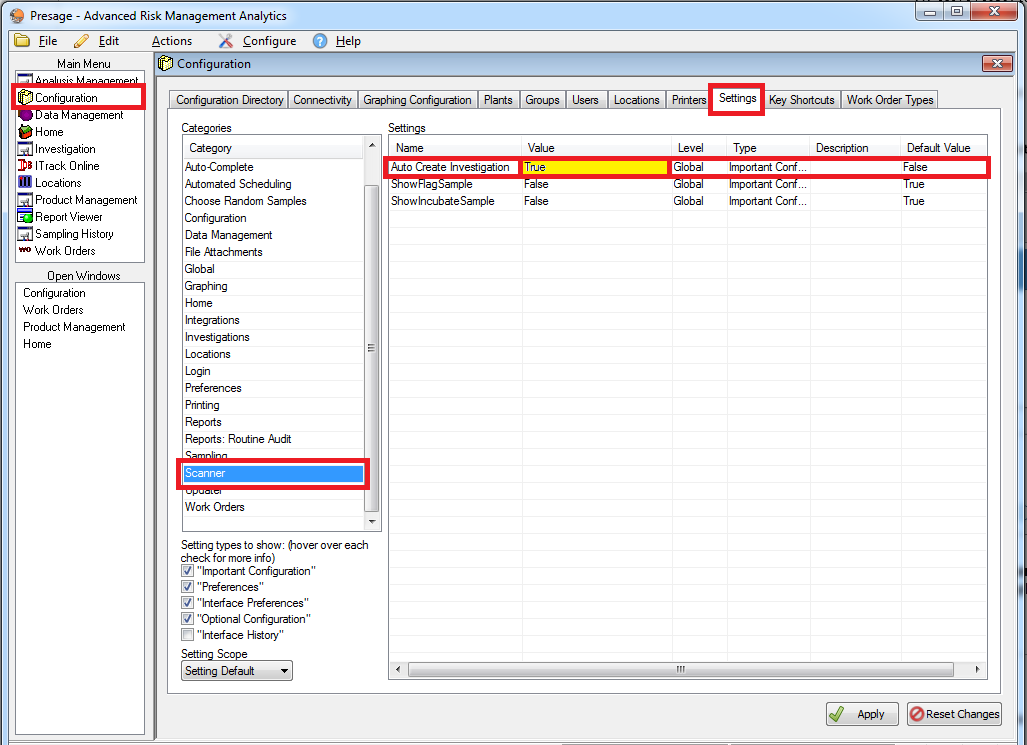
How to turn on the auto-investigation creation feature.
Go to Configuration >> Settings >> Scanner
Then type in 'true' under Value for the Auto Create Investigation setting.
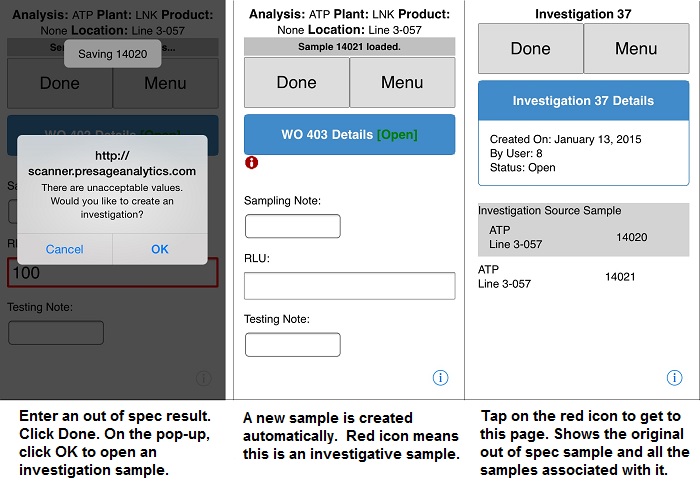
Below is how this feature works:
