Presage/User Guide/Sampling Screen
Sampling History Tab
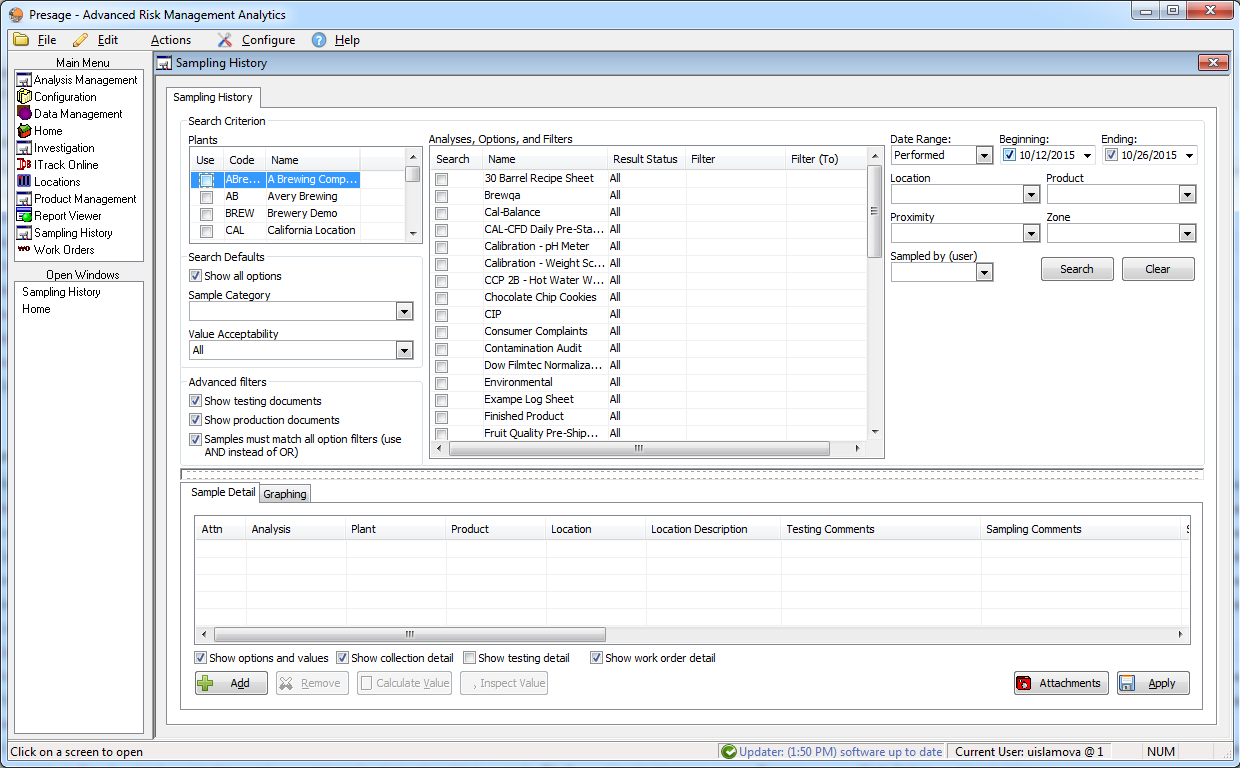
This screen is used as a search engine which makes it easy to find past sampling information.
Click on the link below to watch a VIDEO TUTORIAL for the Sampling History screen.
Search Data in Sampling History
Check the box(es) next to the plant(s), analysis name(s) (which drops down the list of options), option(s); plug in the variables in the boxes provided: date range, location, product, user, proximity and/or zone.
Selecting a Sampling Category will automatically check the boxes of all analyses associated with the category. Option boxes will still have to be selected for each of those analyses.
Select a Value Acceptability to filter data to certain statuses such as Unacceptable, Acceptable, Marginal, etc.
Click Search.
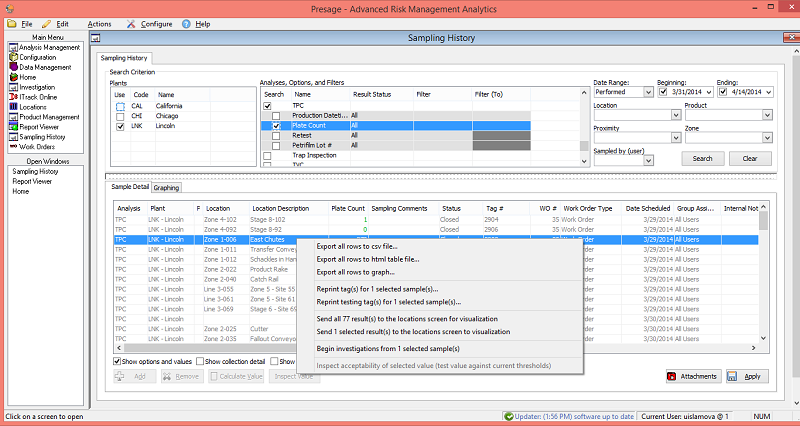
Once historical data is pulled up on the sampling screen, four things can be done:
1) Sent to the scatter graph for trending as explained above. 2) Sent to the Location Visualization which shows the sample acceptability over the plant layout. 3) Sent to the Graphing to do more complex charting. 4) Exported to a .csv file.
Click on the column title on the table, to order the data by a certain criteria. For example, click on the Performed On to see results in chronological order of date performed.
To restart the search filter, click Clear. It will clear out all filters entered previously and drop-down the search filter panel.
Uncheck the 'Show collection detail' box to hide 'Performed On' and 'Performed By' columns. These fields are auto-populated in the Work Order screen as soon as results are entered.
Uncheck the 'Show testing detail' box to hide the 'Testing Began', 'Testing Ended', and 'Tested By' columns. These fields are related to incubation of samples.
Uncheck the 'Show work order detail' box to hide the 'WO#', 'Work Order Type', 'Internal Notes', 'Sampling Instructions', 'Group Assigned', 'Date Created', 'Date Scheduled', and 'Date Due' columns. These are all work order level information.
Keep 'Show options and values' box checked.
To Trend Data:
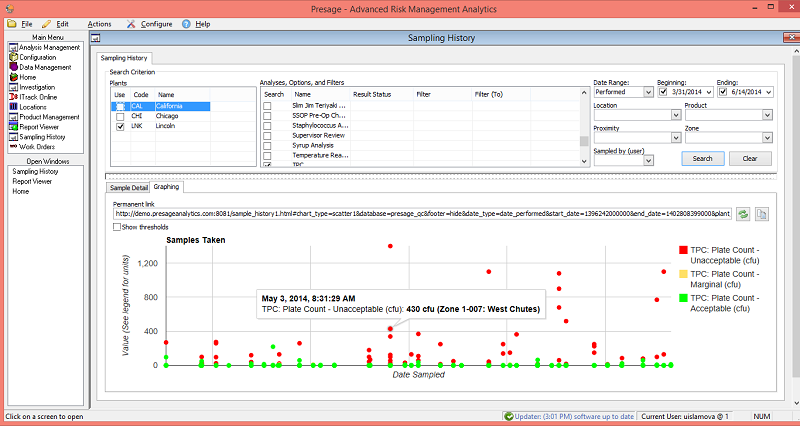
Click the Graphing tab for a scatter graph for the criteria selected.
Select and edit criteria for the graph using the same panel as used with sampling history on the upper portion of the screen.
Hover over points to view details such as date, time, analysis, analysis option, location, etc.
Hover over a label in the map key to highlight the group of points which belong to that label.
To share the graph with a third party, click on the copy icon next to the browser link box on the mid-right side of the screen (it is the second button next to the browser link box). Then paste the link.
Check the Show Thresholds button to see the threshold lines on the graph.
Visualization
To see Location Visualization:
First, enter criteria and pull up historical data. Right-click on one of the rows. A dialog with multiple options pops-up. Click send all # results to the locations screen for visualization.
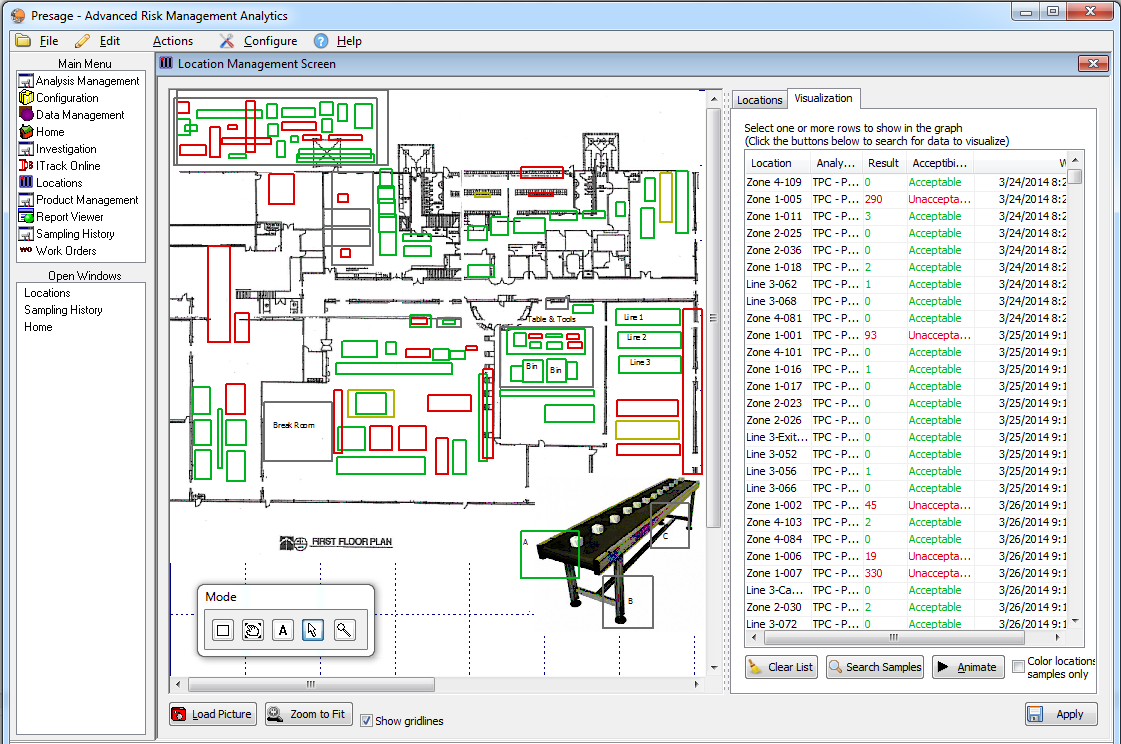
A new screen opens up. This is the Visualization tab under Locations Screen.
On the left display, locations are highlighted in green and red. Green locations are ones with acceptable counts, and red locations are ones with fail counts.
Highlight a row on the right and the corresponding location will be highlighted automatically on the left display and vice versa.
Order the Date Sampled column by clicking on the column title When. Click the first row and press the down-arrow on the keyboard to see a play-through of where the samples were taken in a chronological order.
Note: Every row can be ordered by clicking the column title.
Check the box Color locations based on selected samples only, and select a group of rows to see the colors only for those selected.
Graphing
To do more complex graphing:
Once historical data is pulled up on the sampling screen, this data can be graphed in multiple ways, in addition to the scatter graph.
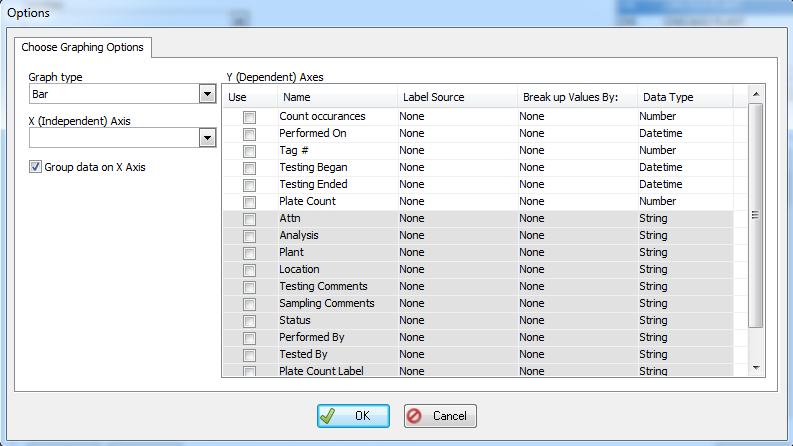
First, enter criteria and pull up historical data. Right-click on one of the rows. A dialogue with multiple options pops-up. Click export all rows to graph.
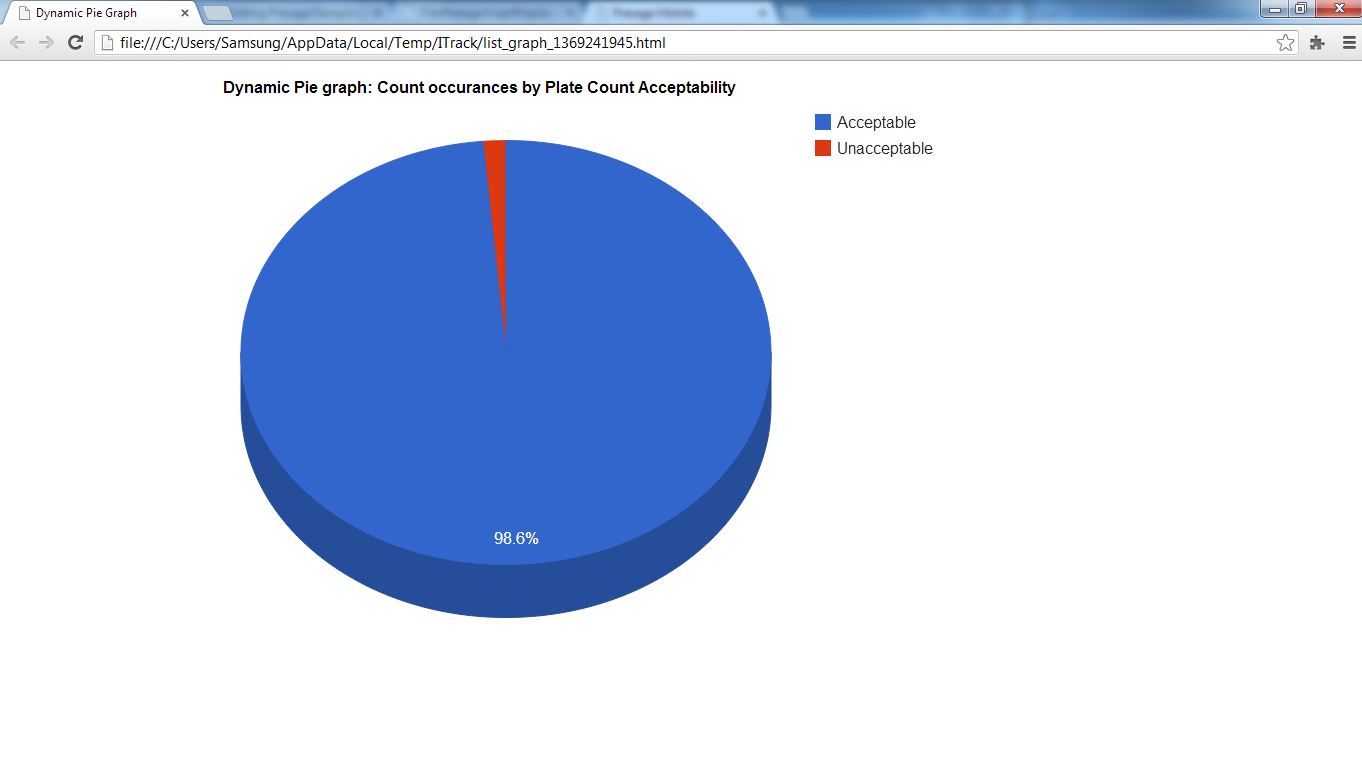
The following dialog pops-up. Make selections, then click OK. The graph will open in a new browser page.
These graphs are saved in the local computer and cannot be shared with third-parties.
Export Data
Please, contact a Presage representative for exports.
